Sudanese vs Pennsylvania German Male Disability
COMPARE
Sudanese
Pennsylvania German
Male Disability
Male Disability Comparison
Sudanese
Pennsylvania Germans
11.0%
MALE DISABILITY
77.1/ 100
METRIC RATING
148th/ 347
METRIC RANK
13.0%
MALE DISABILITY
0.0/ 100
METRIC RATING
298th/ 347
METRIC RANK
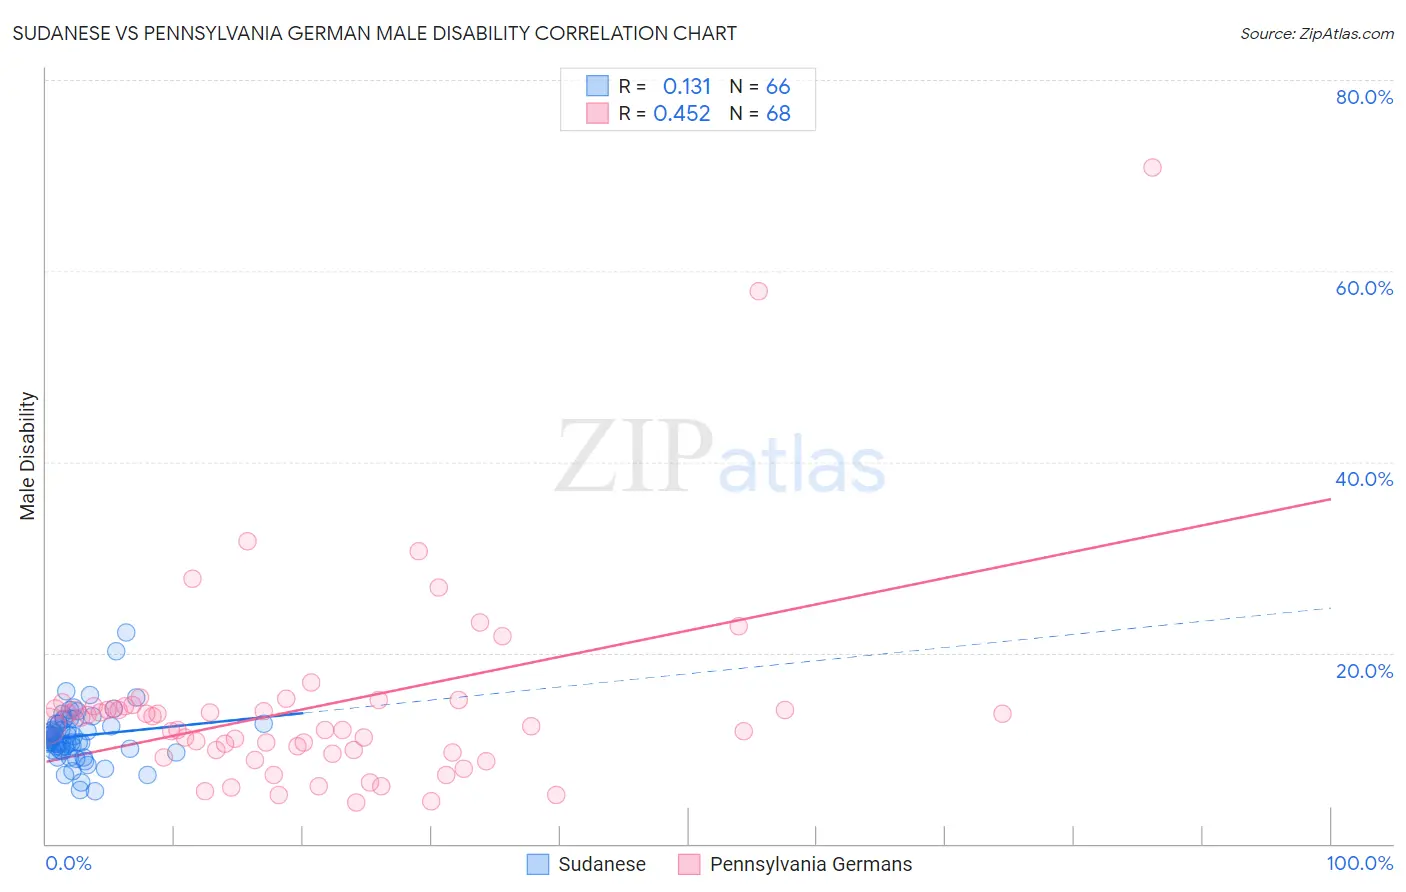
Sudanese vs Pennsylvania German Male Disability Correlation Chart
The statistical analysis conducted on geographies consisting of 110,141,954 people shows a poor positive correlation between the proportion of Sudanese and percentage of males with a disability in the United States with a correlation coefficient (R) of 0.131 and weighted average of 11.0%. Similarly, the statistical analysis conducted on geographies consisting of 234,089,668 people shows a moderate positive correlation between the proportion of Pennsylvania Germans and percentage of males with a disability in the United States with a correlation coefficient (R) of 0.452 and weighted average of 13.0%, a difference of 17.7%.
Male Disability Correlation Summary
| Measurement | Sudanese | Pennsylvania German |
| Minimum | 5.5% | 4.3% |
| Maximum | 22.1% | 70.8% |
| Range | 16.7% | 66.6% |
| Mean | 11.3% | 14.3% |
| Median | 11.1% | 12.8% |
| Interquartile 25% (IQ1) | 9.8% | 9.6% |
| Interquartile 75% (IQ3) | 12.6% | 14.4% |
| Interquartile Range (IQR) | 2.7% | 4.8% |
| Standard Deviation (Sample) | 2.8% | 10.5% |
| Standard Deviation (Population) | 2.8% | 10.4% |
Similar Demographics by Male Disability
Demographics Similar to Sudanese by Male Disability
In terms of male disability, the demographic groups most similar to Sudanese are Immigrants from Croatia (11.0%, a difference of 0.010%), Korean (11.0%, a difference of 0.030%), Immigrants from Denmark (11.0%, a difference of 0.060%), Costa Rican (11.0%, a difference of 0.070%), and Kenyan (11.0%, a difference of 0.080%).
| Demographics | Rating | Rank | Male Disability |
| Arabs | 81.5 /100 | #141 | Excellent 11.0% |
| Immigrants | Sudan | 81.5 /100 | #142 | Excellent 11.0% |
| Moroccans | 80.7 /100 | #143 | Excellent 11.0% |
| Kenyans | 78.1 /100 | #144 | Good 11.0% |
| Costa Ricans | 78.0 /100 | #145 | Good 11.0% |
| Koreans | 77.5 /100 | #146 | Good 11.0% |
| Immigrants | Croatia | 77.3 /100 | #147 | Good 11.0% |
| Sudanese | 77.1 /100 | #148 | Good 11.0% |
| Immigrants | Denmark | 76.4 /100 | #149 | Good 11.0% |
| Immigrants | Guatemala | 75.1 /100 | #150 | Good 11.0% |
| Cubans | 74.9 /100 | #151 | Good 11.0% |
| Immigrants | Albania | 74.4 /100 | #152 | Good 11.0% |
| Immigrants | Northern Europe | 73.2 /100 | #153 | Good 11.1% |
| Immigrants | Moldova | 72.8 /100 | #154 | Good 11.1% |
| Immigrants | Middle Africa | 70.9 /100 | #155 | Good 11.1% |
Demographics Similar to Pennsylvania Germans by Male Disability
In terms of male disability, the demographic groups most similar to Pennsylvania Germans are Inupiat (13.0%, a difference of 0.20%), Nonimmigrants (12.9%, a difference of 0.31%), Celtic (13.0%, a difference of 0.35%), Immigrants from Micronesia (12.9%, a difference of 0.37%), and Cheyenne (13.0%, a difference of 0.44%).
| Demographics | Rating | Rank | Male Disability |
| Whites/Caucasians | 0.0 /100 | #291 | Tragic 12.8% |
| English | 0.0 /100 | #292 | Tragic 12.8% |
| Yaqui | 0.0 /100 | #293 | Tragic 12.9% |
| Marshallese | 0.0 /100 | #294 | Tragic 12.9% |
| Immigrants | Micronesia | 0.0 /100 | #295 | Tragic 12.9% |
| Immigrants | Nonimmigrants | 0.0 /100 | #296 | Tragic 12.9% |
| Inupiat | 0.0 /100 | #297 | Tragic 13.0% |
| Pennsylvania Germans | 0.0 /100 | #298 | Tragic 13.0% |
| Celtics | 0.0 /100 | #299 | Tragic 13.0% |
| Cheyenne | 0.0 /100 | #300 | Tragic 13.0% |
| French | 0.0 /100 | #301 | Tragic 13.0% |
| Crow | 0.0 /100 | #302 | Tragic 13.1% |
| Scotch-Irish | 0.0 /100 | #303 | Tragic 13.2% |
| Blacks/African Americans | 0.0 /100 | #304 | Tragic 13.2% |
| French Canadians | 0.0 /100 | #305 | Tragic 13.3% |