British vs Immigrants from Ecuador Male Disability
COMPARE
British
Immigrants from Ecuador
Male Disability
Male Disability Comparison
British
Immigrants from Ecuador
12.1%
MALE DISABILITY
0.4/ 100
METRIC RATING
254th/ 347
METRIC RANK
10.4%
MALE DISABILITY
99.3/ 100
METRIC RATING
62nd/ 347
METRIC RANK
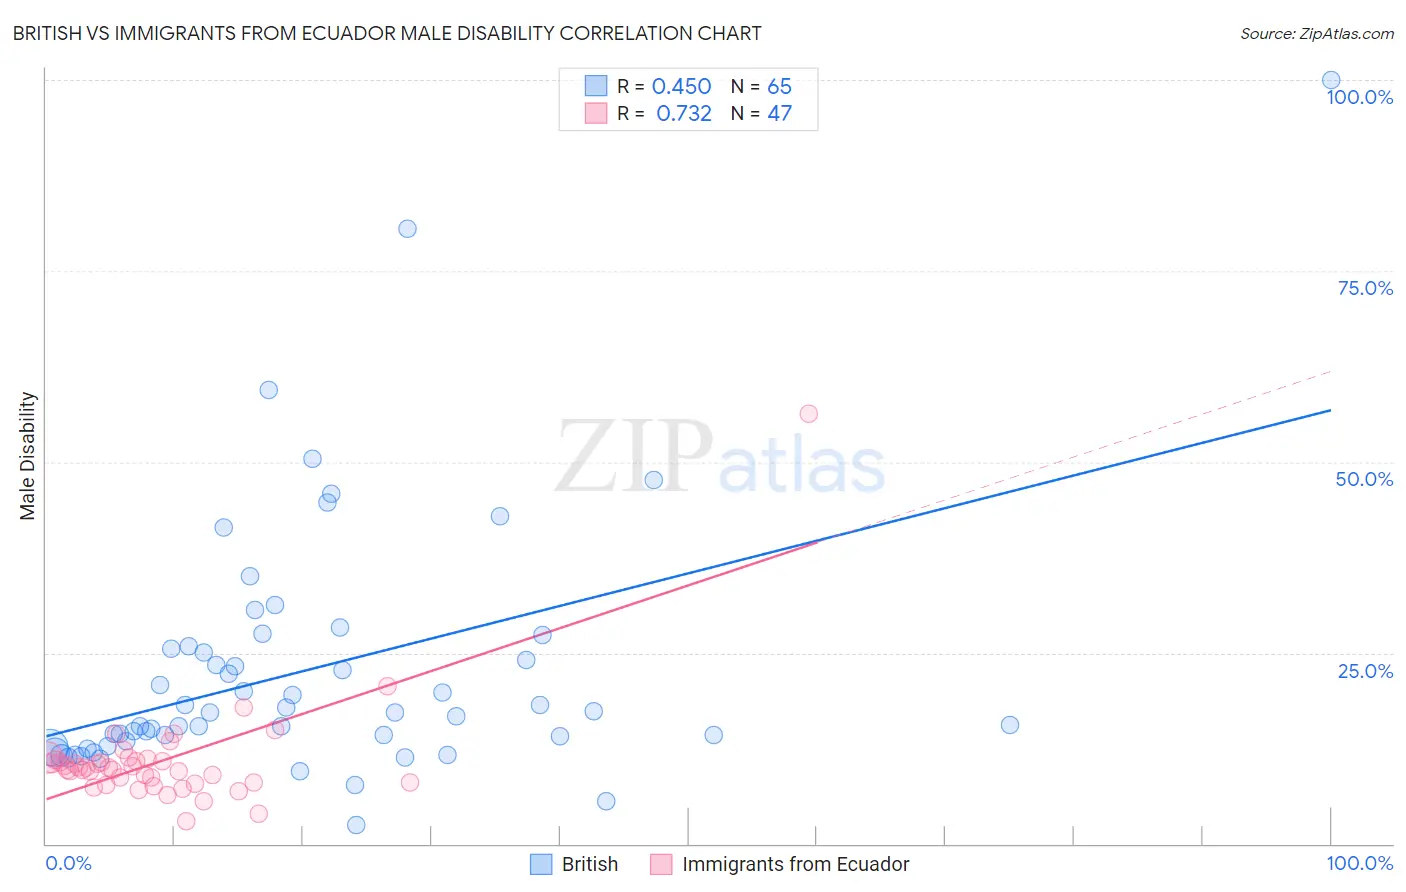
British vs Immigrants from Ecuador Male Disability Correlation Chart
The statistical analysis conducted on geographies consisting of 531,329,993 people shows a moderate positive correlation between the proportion of British and percentage of males with a disability in the United States with a correlation coefficient (R) of 0.450 and weighted average of 12.1%. Similarly, the statistical analysis conducted on geographies consisting of 270,973,645 people shows a strong positive correlation between the proportion of Immigrants from Ecuador and percentage of males with a disability in the United States with a correlation coefficient (R) of 0.732 and weighted average of 10.4%, a difference of 15.5%.
Male Disability Correlation Summary
| Measurement | British | Immigrants from Ecuador |
| Minimum | 2.5% | 3.0% |
| Maximum | 100.0% | 56.2% |
| Range | 97.5% | 53.3% |
| Mean | 22.7% | 10.9% |
| Median | 17.1% | 9.9% |
| Interquartile 25% (IQ1) | 13.2% | 8.0% |
| Interquartile 75% (IQ3) | 25.7% | 11.0% |
| Interquartile Range (IQR) | 12.5% | 3.1% |
| Standard Deviation (Sample) | 16.7% | 7.4% |
| Standard Deviation (Population) | 16.6% | 7.4% |
Similar Demographics by Male Disability
Demographics Similar to British by Male Disability
In terms of male disability, the demographic groups most similar to British are Chinese (12.1%, a difference of 0.010%), Guamanian/Chamorro (12.0%, a difference of 0.18%), Slovene (12.0%, a difference of 0.19%), German Russian (12.0%, a difference of 0.26%), and Swiss (12.1%, a difference of 0.26%).
| Demographics | Rating | Rank | Male Disability |
| Hungarians | 0.8 /100 | #247 | Tragic 12.0% |
| Poles | 0.7 /100 | #248 | Tragic 12.0% |
| Immigrants | Yemen | 0.5 /100 | #249 | Tragic 12.0% |
| Bangladeshis | 0.5 /100 | #250 | Tragic 12.0% |
| German Russians | 0.5 /100 | #251 | Tragic 12.0% |
| Slovenes | 0.5 /100 | #252 | Tragic 12.0% |
| Guamanians/Chamorros | 0.5 /100 | #253 | Tragic 12.0% |
| British | 0.4 /100 | #254 | Tragic 12.1% |
| Chinese | 0.4 /100 | #255 | Tragic 12.1% |
| Swiss | 0.3 /100 | #256 | Tragic 12.1% |
| Europeans | 0.3 /100 | #257 | Tragic 12.1% |
| Basques | 0.3 /100 | #258 | Tragic 12.1% |
| Belgians | 0.3 /100 | #259 | Tragic 12.1% |
| Swedes | 0.3 /100 | #260 | Tragic 12.1% |
| Slavs | 0.2 /100 | #261 | Tragic 12.2% |
Demographics Similar to Immigrants from Ecuador by Male Disability
In terms of male disability, the demographic groups most similar to Immigrants from Ecuador are Immigrants from Belarus (10.4%, a difference of 0.020%), Jordanian (10.5%, a difference of 0.15%), Immigrants from Grenada (10.5%, a difference of 0.17%), Guyanese (10.5%, a difference of 0.17%), and Immigrants from Afghanistan (10.5%, a difference of 0.18%).
| Demographics | Rating | Rank | Male Disability |
| Immigrants | Eritrea | 99.6 /100 | #55 | Exceptional 10.4% |
| Tongans | 99.6 /100 | #56 | Exceptional 10.4% |
| Immigrants | South America | 99.6 /100 | #57 | Exceptional 10.4% |
| Immigrants | Japan | 99.5 /100 | #58 | Exceptional 10.4% |
| Immigrants | Australia | 99.5 /100 | #59 | Exceptional 10.4% |
| Immigrants | Colombia | 99.5 /100 | #60 | Exceptional 10.4% |
| Immigrants | Northern Africa | 99.4 /100 | #61 | Exceptional 10.4% |
| Immigrants | Ecuador | 99.3 /100 | #62 | Exceptional 10.4% |
| Immigrants | Belarus | 99.3 /100 | #63 | Exceptional 10.4% |
| Jordanians | 99.3 /100 | #64 | Exceptional 10.5% |
| Immigrants | Grenada | 99.2 /100 | #65 | Exceptional 10.5% |
| Guyanese | 99.2 /100 | #66 | Exceptional 10.5% |
| Immigrants | Afghanistan | 99.2 /100 | #67 | Exceptional 10.5% |
| Colombians | 99.2 /100 | #68 | Exceptional 10.5% |
| Ecuadorians | 99.2 /100 | #69 | Exceptional 10.5% |