British vs Immigrants from Barbados Male Disability
COMPARE
British
Immigrants from Barbados
Male Disability
Male Disability Comparison
British
Immigrants from Barbados
12.1%
MALE DISABILITY
0.4/ 100
METRIC RATING
254th/ 347
METRIC RANK
10.8%
MALE DISABILITY
92.2/ 100
METRIC RATING
115th/ 347
METRIC RANK
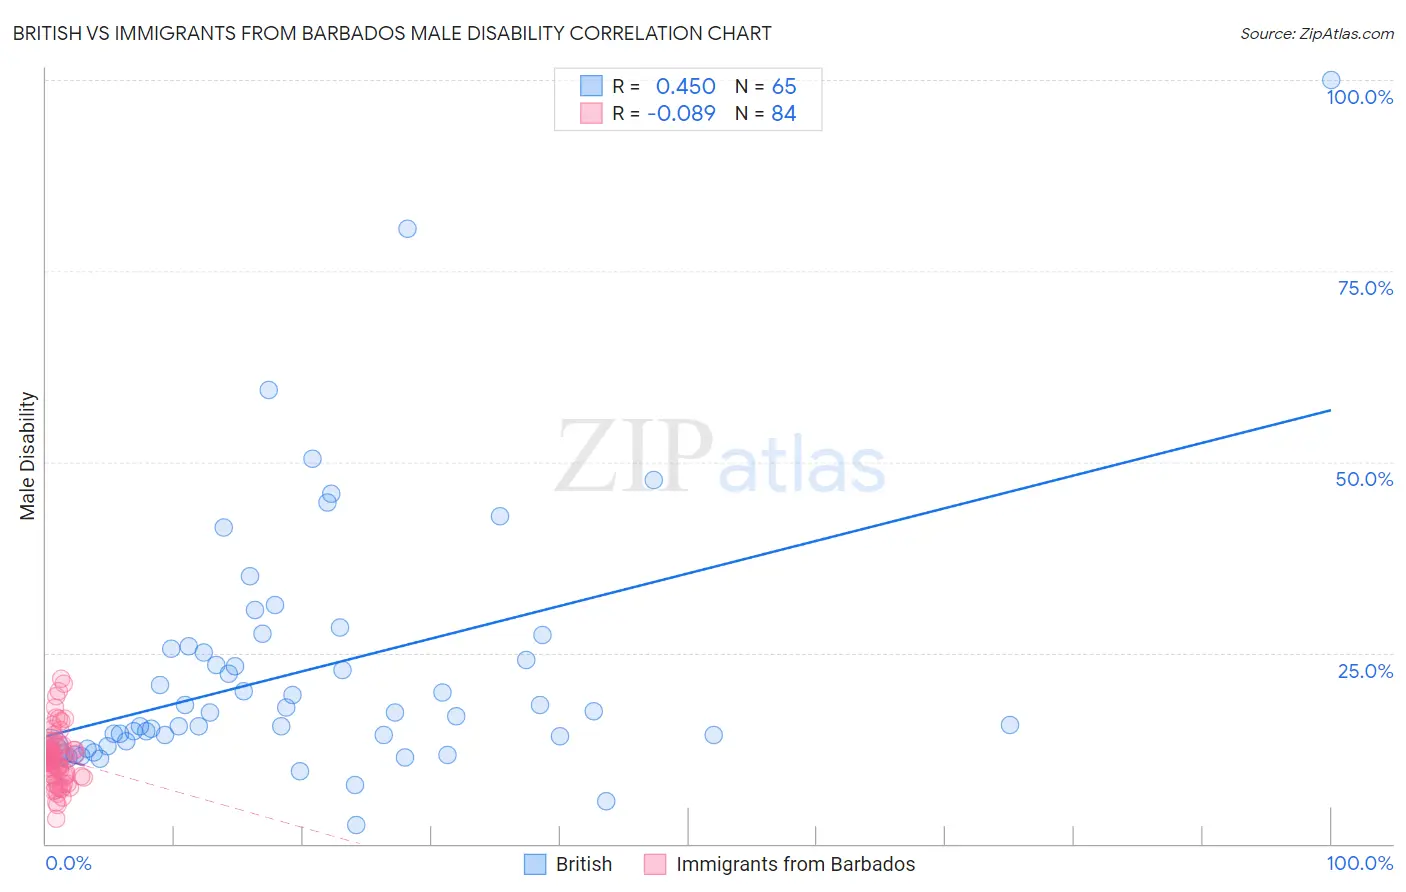
British vs Immigrants from Barbados Male Disability Correlation Chart
The statistical analysis conducted on geographies consisting of 531,329,993 people shows a moderate positive correlation between the proportion of British and percentage of males with a disability in the United States with a correlation coefficient (R) of 0.450 and weighted average of 12.1%. Similarly, the statistical analysis conducted on geographies consisting of 112,772,632 people shows a slight negative correlation between the proportion of Immigrants from Barbados and percentage of males with a disability in the United States with a correlation coefficient (R) of -0.089 and weighted average of 10.8%, a difference of 11.4%.
Male Disability Correlation Summary
| Measurement | British | Immigrants from Barbados |
| Minimum | 2.5% | 3.3% |
| Maximum | 100.0% | 21.5% |
| Range | 97.5% | 18.2% |
| Mean | 22.7% | 11.3% |
| Median | 17.1% | 11.4% |
| Interquartile 25% (IQ1) | 13.2% | 9.1% |
| Interquartile 75% (IQ3) | 25.7% | 12.5% |
| Interquartile Range (IQR) | 12.5% | 3.4% |
| Standard Deviation (Sample) | 16.7% | 3.4% |
| Standard Deviation (Population) | 16.6% | 3.4% |
Similar Demographics by Male Disability
Demographics Similar to British by Male Disability
In terms of male disability, the demographic groups most similar to British are Chinese (12.1%, a difference of 0.010%), Guamanian/Chamorro (12.0%, a difference of 0.18%), Slovene (12.0%, a difference of 0.19%), German Russian (12.0%, a difference of 0.26%), and Swiss (12.1%, a difference of 0.26%).
| Demographics | Rating | Rank | Male Disability |
| Hungarians | 0.8 /100 | #247 | Tragic 12.0% |
| Poles | 0.7 /100 | #248 | Tragic 12.0% |
| Immigrants | Yemen | 0.5 /100 | #249 | Tragic 12.0% |
| Bangladeshis | 0.5 /100 | #250 | Tragic 12.0% |
| German Russians | 0.5 /100 | #251 | Tragic 12.0% |
| Slovenes | 0.5 /100 | #252 | Tragic 12.0% |
| Guamanians/Chamorros | 0.5 /100 | #253 | Tragic 12.0% |
| British | 0.4 /100 | #254 | Tragic 12.1% |
| Chinese | 0.4 /100 | #255 | Tragic 12.1% |
| Swiss | 0.3 /100 | #256 | Tragic 12.1% |
| Europeans | 0.3 /100 | #257 | Tragic 12.1% |
| Basques | 0.3 /100 | #258 | Tragic 12.1% |
| Belgians | 0.3 /100 | #259 | Tragic 12.1% |
| Swedes | 0.3 /100 | #260 | Tragic 12.1% |
| Slavs | 0.2 /100 | #261 | Tragic 12.2% |
Demographics Similar to Immigrants from Barbados by Male Disability
In terms of male disability, the demographic groups most similar to Immigrants from Barbados are Immigrants from South Africa (10.8%, a difference of 0.080%), Central American (10.8%, a difference of 0.10%), Immigrants from Zimbabwe (10.8%, a difference of 0.16%), Ghanaian (10.8%, a difference of 0.25%), and Eastern European (10.9%, a difference of 0.29%).
| Demographics | Rating | Rank | Male Disability |
| Immigrants | Belgium | 94.2 /100 | #108 | Exceptional 10.8% |
| Immigrants | Uganda | 94.0 /100 | #109 | Exceptional 10.8% |
| Immigrants | Immigrants | 93.9 /100 | #110 | Exceptional 10.8% |
| Immigrants | Uruguay | 93.8 /100 | #111 | Exceptional 10.8% |
| Ghanaians | 93.4 /100 | #112 | Exceptional 10.8% |
| Immigrants | Zimbabwe | 93.0 /100 | #113 | Exceptional 10.8% |
| Central Americans | 92.7 /100 | #114 | Exceptional 10.8% |
| Immigrants | Barbados | 92.2 /100 | #115 | Exceptional 10.8% |
| Immigrants | South Africa | 91.8 /100 | #116 | Exceptional 10.8% |
| Eastern Europeans | 90.6 /100 | #117 | Exceptional 10.9% |
| Immigrants | Cuba | 90.2 /100 | #118 | Exceptional 10.9% |
| Armenians | 90.1 /100 | #119 | Exceptional 10.9% |
| Immigrants | Africa | 89.4 /100 | #120 | Excellent 10.9% |
| Immigrants | South Eastern Asia | 89.2 /100 | #121 | Excellent 10.9% |
| Immigrants | Ghana | 89.0 /100 | #122 | Excellent 10.9% |