Immigrants from Western Africa vs Pennsylvania German Male Disability
COMPARE
Immigrants from Western Africa
Pennsylvania German
Male Disability
Male Disability Comparison
Immigrants from Western Africa
Pennsylvania Germans
11.1%
MALE DISABILITY
69.2/ 100
METRIC RATING
157th/ 347
METRIC RANK
13.0%
MALE DISABILITY
0.0/ 100
METRIC RATING
298th/ 347
METRIC RANK
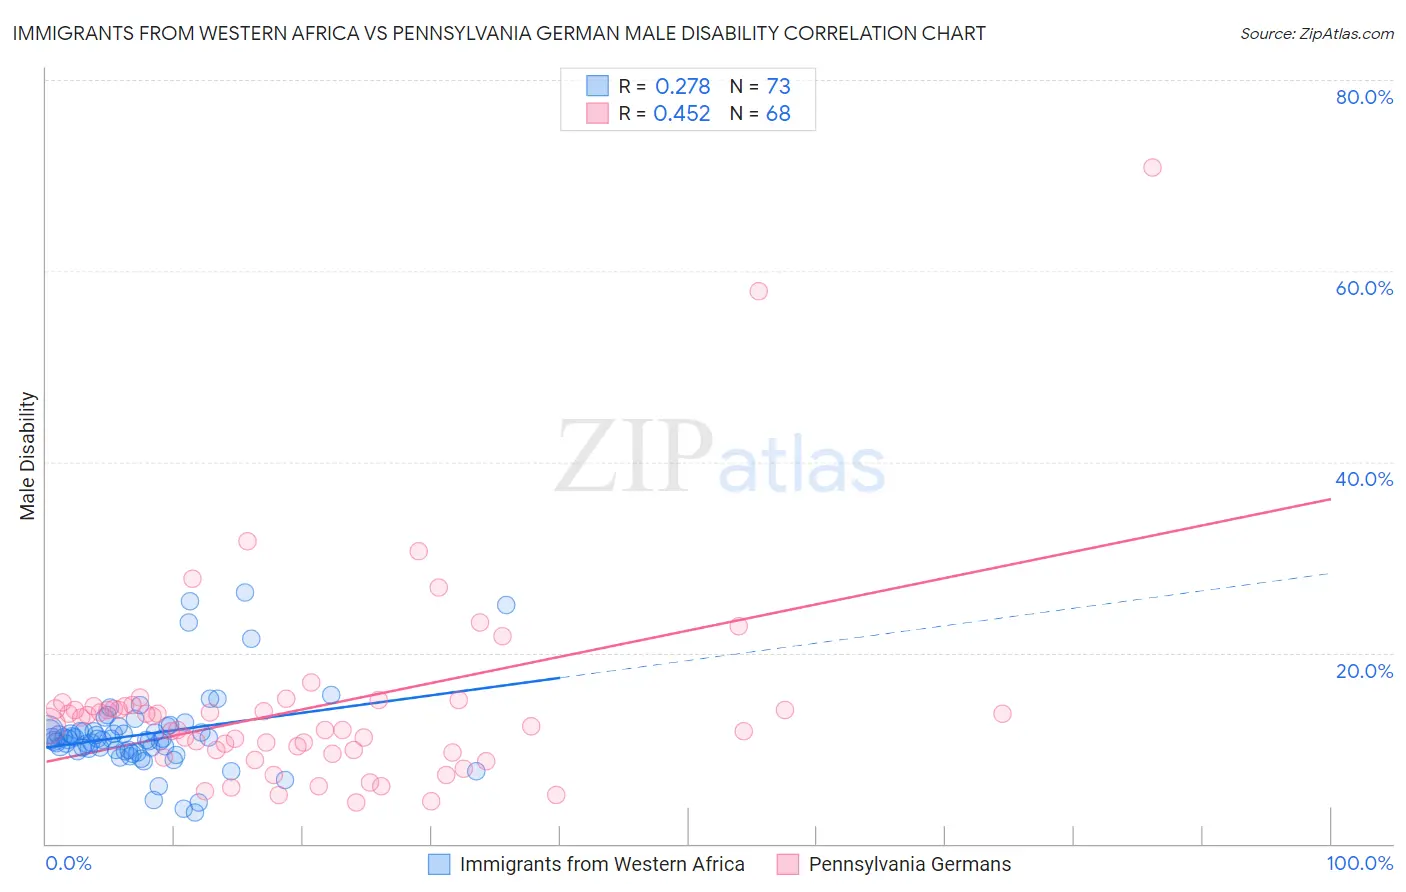
Immigrants from Western Africa vs Pennsylvania German Male Disability Correlation Chart
The statistical analysis conducted on geographies consisting of 357,781,594 people shows a weak positive correlation between the proportion of Immigrants from Western Africa and percentage of males with a disability in the United States with a correlation coefficient (R) of 0.278 and weighted average of 11.1%. Similarly, the statistical analysis conducted on geographies consisting of 234,089,668 people shows a moderate positive correlation between the proportion of Pennsylvania Germans and percentage of males with a disability in the United States with a correlation coefficient (R) of 0.452 and weighted average of 13.0%, a difference of 17.0%.
Male Disability Correlation Summary
| Measurement | Immigrants from Western Africa | Pennsylvania German |
| Minimum | 3.3% | 4.3% |
| Maximum | 26.3% | 70.8% |
| Range | 23.0% | 66.6% |
| Mean | 11.5% | 14.3% |
| Median | 11.0% | 12.8% |
| Interquartile 25% (IQ1) | 9.8% | 9.6% |
| Interquartile 75% (IQ3) | 11.8% | 14.4% |
| Interquartile Range (IQR) | 2.0% | 4.8% |
| Standard Deviation (Sample) | 4.2% | 10.5% |
| Standard Deviation (Population) | 4.2% | 10.4% |
Similar Demographics by Male Disability
Demographics Similar to Immigrants from Western Africa by Male Disability
In terms of male disability, the demographic groups most similar to Immigrants from Western Africa are Russian (11.1%, a difference of 0.040%), Latvian (11.1%, a difference of 0.070%), Immigrants from Middle Africa (11.1%, a difference of 0.11%), Guatemalan (11.1%, a difference of 0.13%), and Albanian (11.1%, a difference of 0.18%).
| Demographics | Rating | Rank | Male Disability |
| Immigrants | Guatemala | 75.1 /100 | #150 | Good 11.0% |
| Cubans | 74.9 /100 | #151 | Good 11.0% |
| Immigrants | Albania | 74.4 /100 | #152 | Good 11.0% |
| Immigrants | Northern Europe | 73.2 /100 | #153 | Good 11.1% |
| Immigrants | Moldova | 72.8 /100 | #154 | Good 11.1% |
| Immigrants | Middle Africa | 70.9 /100 | #155 | Good 11.1% |
| Russians | 69.8 /100 | #156 | Good 11.1% |
| Immigrants | Western Africa | 69.2 /100 | #157 | Good 11.1% |
| Latvians | 68.1 /100 | #158 | Good 11.1% |
| Guatemalans | 67.2 /100 | #159 | Good 11.1% |
| Albanians | 66.5 /100 | #160 | Good 11.1% |
| Immigrants | West Indies | 65.7 /100 | #161 | Good 11.1% |
| Immigrants | Haiti | 65.3 /100 | #162 | Good 11.1% |
| Immigrants | Kenya | 63.8 /100 | #163 | Good 11.1% |
| British West Indians | 62.8 /100 | #164 | Good 11.1% |
Demographics Similar to Pennsylvania Germans by Male Disability
In terms of male disability, the demographic groups most similar to Pennsylvania Germans are Inupiat (13.0%, a difference of 0.20%), Nonimmigrants (12.9%, a difference of 0.31%), Celtic (13.0%, a difference of 0.35%), Immigrants from Micronesia (12.9%, a difference of 0.37%), and Cheyenne (13.0%, a difference of 0.44%).
| Demographics | Rating | Rank | Male Disability |
| Whites/Caucasians | 0.0 /100 | #291 | Tragic 12.8% |
| English | 0.0 /100 | #292 | Tragic 12.8% |
| Yaqui | 0.0 /100 | #293 | Tragic 12.9% |
| Marshallese | 0.0 /100 | #294 | Tragic 12.9% |
| Immigrants | Micronesia | 0.0 /100 | #295 | Tragic 12.9% |
| Immigrants | Nonimmigrants | 0.0 /100 | #296 | Tragic 12.9% |
| Inupiat | 0.0 /100 | #297 | Tragic 13.0% |
| Pennsylvania Germans | 0.0 /100 | #298 | Tragic 13.0% |
| Celtics | 0.0 /100 | #299 | Tragic 13.0% |
| Cheyenne | 0.0 /100 | #300 | Tragic 13.0% |
| French | 0.0 /100 | #301 | Tragic 13.0% |
| Crow | 0.0 /100 | #302 | Tragic 13.1% |
| Scotch-Irish | 0.0 /100 | #303 | Tragic 13.2% |
| Blacks/African Americans | 0.0 /100 | #304 | Tragic 13.2% |
| French Canadians | 0.0 /100 | #305 | Tragic 13.3% |