British vs Korean Male Disability
COMPARE
British
Korean
Male Disability
Male Disability Comparison
British
Koreans
12.1%
MALE DISABILITY
0.4/ 100
METRIC RATING
254th/ 347
METRIC RANK
11.0%
MALE DISABILITY
77.5/ 100
METRIC RATING
146th/ 347
METRIC RANK
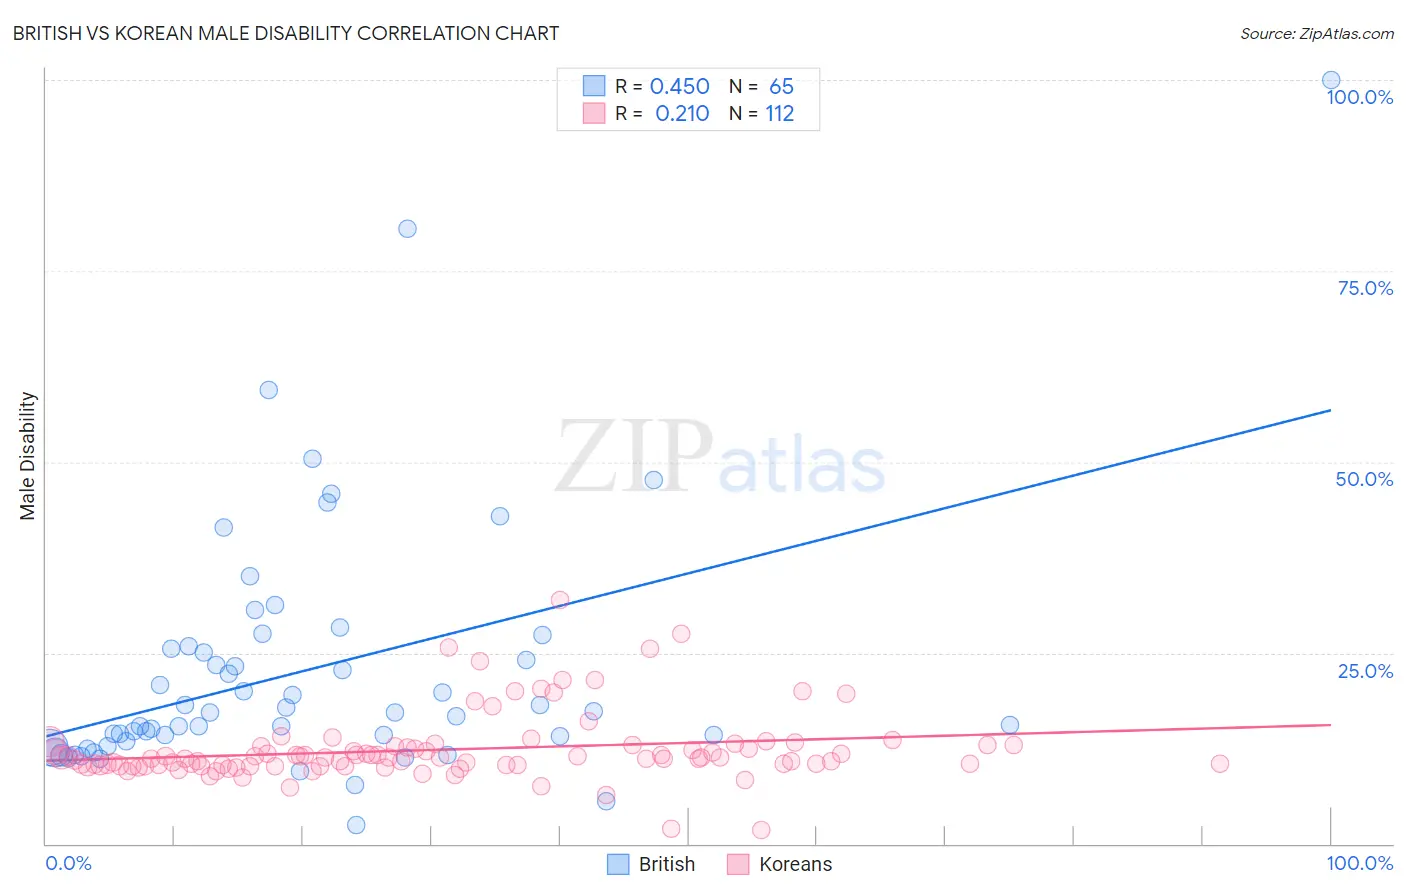
British vs Korean Male Disability Correlation Chart
The statistical analysis conducted on geographies consisting of 531,329,993 people shows a moderate positive correlation between the proportion of British and percentage of males with a disability in the United States with a correlation coefficient (R) of 0.450 and weighted average of 12.1%. Similarly, the statistical analysis conducted on geographies consisting of 510,777,181 people shows a weak positive correlation between the proportion of Koreans and percentage of males with a disability in the United States with a correlation coefficient (R) of 0.210 and weighted average of 11.0%, a difference of 9.4%.
Male Disability Correlation Summary
| Measurement | British | Korean |
| Minimum | 2.5% | 1.8% |
| Maximum | 100.0% | 31.9% |
| Range | 97.5% | 30.1% |
| Mean | 22.7% | 12.3% |
| Median | 17.1% | 11.3% |
| Interquartile 25% (IQ1) | 13.2% | 10.3% |
| Interquartile 75% (IQ3) | 25.7% | 12.8% |
| Interquartile Range (IQR) | 12.5% | 2.5% |
| Standard Deviation (Sample) | 16.7% | 4.5% |
| Standard Deviation (Population) | 16.6% | 4.5% |
Similar Demographics by Male Disability
Demographics Similar to British by Male Disability
In terms of male disability, the demographic groups most similar to British are Chinese (12.1%, a difference of 0.010%), Guamanian/Chamorro (12.0%, a difference of 0.18%), Slovene (12.0%, a difference of 0.19%), German Russian (12.0%, a difference of 0.26%), and Swiss (12.1%, a difference of 0.26%).
| Demographics | Rating | Rank | Male Disability |
| Hungarians | 0.8 /100 | #247 | Tragic 12.0% |
| Poles | 0.7 /100 | #248 | Tragic 12.0% |
| Immigrants | Yemen | 0.5 /100 | #249 | Tragic 12.0% |
| Bangladeshis | 0.5 /100 | #250 | Tragic 12.0% |
| German Russians | 0.5 /100 | #251 | Tragic 12.0% |
| Slovenes | 0.5 /100 | #252 | Tragic 12.0% |
| Guamanians/Chamorros | 0.5 /100 | #253 | Tragic 12.0% |
| British | 0.4 /100 | #254 | Tragic 12.1% |
| Chinese | 0.4 /100 | #255 | Tragic 12.1% |
| Swiss | 0.3 /100 | #256 | Tragic 12.1% |
| Europeans | 0.3 /100 | #257 | Tragic 12.1% |
| Basques | 0.3 /100 | #258 | Tragic 12.1% |
| Belgians | 0.3 /100 | #259 | Tragic 12.1% |
| Swedes | 0.3 /100 | #260 | Tragic 12.1% |
| Slavs | 0.2 /100 | #261 | Tragic 12.2% |
Demographics Similar to Koreans by Male Disability
In terms of male disability, the demographic groups most similar to Koreans are Immigrants from Croatia (11.0%, a difference of 0.020%), Sudanese (11.0%, a difference of 0.030%), Costa Rican (11.0%, a difference of 0.040%), Kenyan (11.0%, a difference of 0.050%), and Immigrants from Denmark (11.0%, a difference of 0.090%).
| Demographics | Rating | Rank | Male Disability |
| South Africans | 81.7 /100 | #139 | Excellent 11.0% |
| Immigrants | Italy | 81.5 /100 | #140 | Excellent 11.0% |
| Arabs | 81.5 /100 | #141 | Excellent 11.0% |
| Immigrants | Sudan | 81.5 /100 | #142 | Excellent 11.0% |
| Moroccans | 80.7 /100 | #143 | Excellent 11.0% |
| Kenyans | 78.1 /100 | #144 | Good 11.0% |
| Costa Ricans | 78.0 /100 | #145 | Good 11.0% |
| Koreans | 77.5 /100 | #146 | Good 11.0% |
| Immigrants | Croatia | 77.3 /100 | #147 | Good 11.0% |
| Sudanese | 77.1 /100 | #148 | Good 11.0% |
| Immigrants | Denmark | 76.4 /100 | #149 | Good 11.0% |
| Immigrants | Guatemala | 75.1 /100 | #150 | Good 11.0% |
| Cubans | 74.9 /100 | #151 | Good 11.0% |
| Immigrants | Albania | 74.4 /100 | #152 | Good 11.0% |
| Immigrants | Northern Europe | 73.2 /100 | #153 | Good 11.1% |