British vs Pennsylvania German Associate's Degree
COMPARE
British
Pennsylvania German
Associate's Degree
Associate's Degree Comparison
British
Pennsylvania Germans
48.9%
ASSOCIATE'S DEGREE
95.0/ 100
METRIC RATING
116th/ 347
METRIC RANK
37.2%
ASSOCIATE'S DEGREE
0.0/ 100
METRIC RATING
322nd/ 347
METRIC RANK
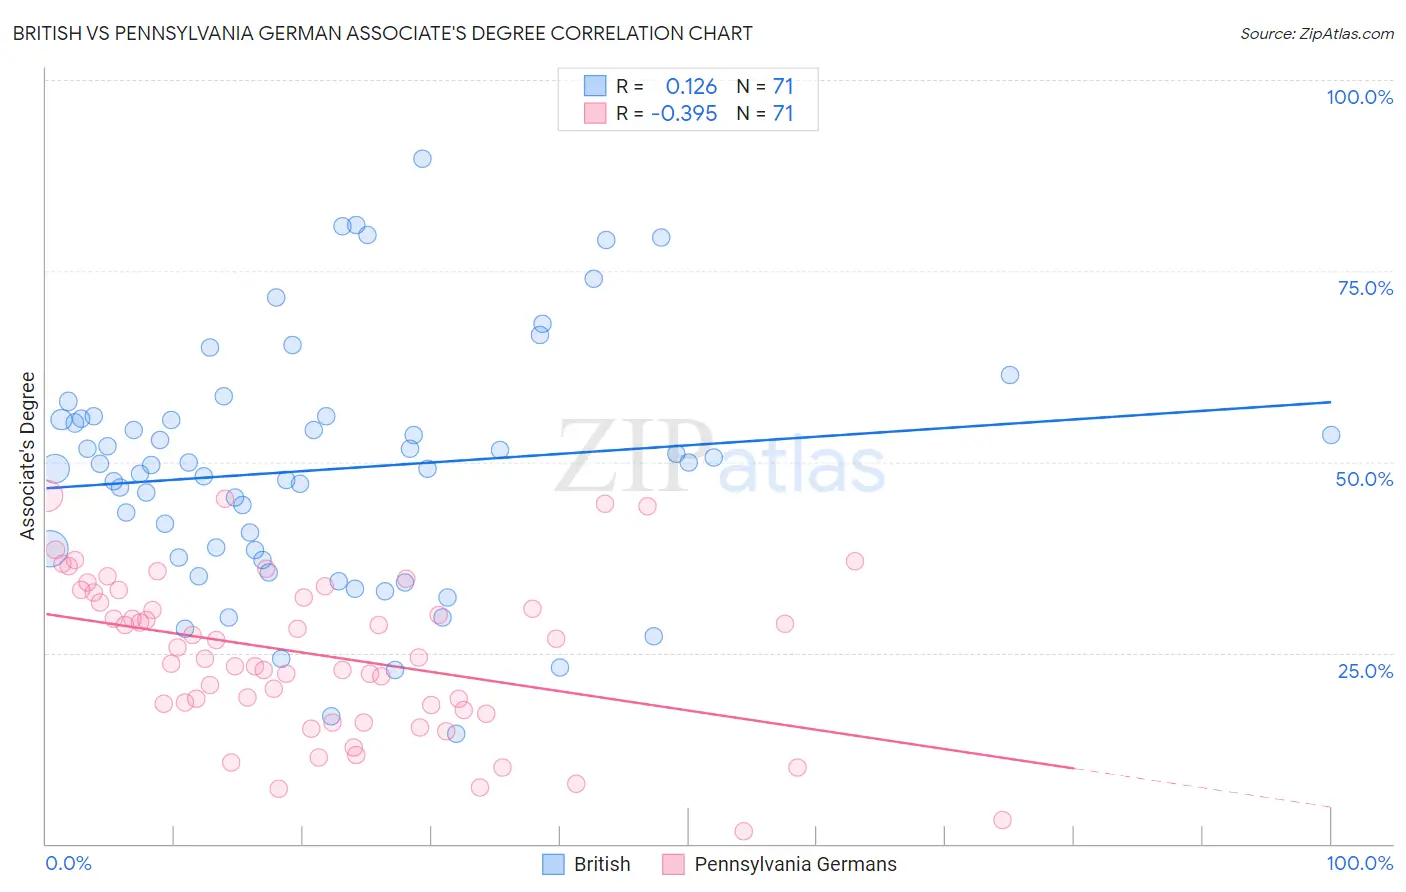
British vs Pennsylvania German Associate's Degree Correlation Chart
The statistical analysis conducted on geographies consisting of 531,402,348 people shows a poor positive correlation between the proportion of British and percentage of population with at least associate's degree education in the United States with a correlation coefficient (R) of 0.126 and weighted average of 48.9%. Similarly, the statistical analysis conducted on geographies consisting of 234,093,670 people shows a mild negative correlation between the proportion of Pennsylvania Germans and percentage of population with at least associate's degree education in the United States with a correlation coefficient (R) of -0.395 and weighted average of 37.2%, a difference of 31.4%.
Associate's Degree Correlation Summary
| Measurement | British | Pennsylvania German |
| Minimum | 14.3% | 1.6% |
| Maximum | 89.7% | 45.5% |
| Range | 75.3% | 44.0% |
| Mean | 49.0% | 24.7% |
| Median | 49.7% | 24.4% |
| Interquartile 25% (IQ1) | 37.4% | 17.5% |
| Interquartile 75% (IQ3) | 55.7% | 32.9% |
| Interquartile Range (IQR) | 18.3% | 15.3% |
| Standard Deviation (Sample) | 15.9% | 10.3% |
| Standard Deviation (Population) | 15.8% | 10.2% |
Similar Demographics by Associate's Degree
Demographics Similar to British by Associate's Degree
In terms of associate's degree, the demographic groups most similar to British are Afghan (48.9%, a difference of 0.040%), Luxembourger (48.9%, a difference of 0.070%), Albanian (48.8%, a difference of 0.11%), Lebanese (48.8%, a difference of 0.12%), and Palestinian (49.0%, a difference of 0.13%).
| Demographics | Rating | Rank | Associate's Degree |
| Immigrants | Morocco | 96.3 /100 | #109 | Exceptional 49.2% |
| Austrians | 95.8 /100 | #110 | Exceptional 49.1% |
| Immigrants | Venezuela | 95.8 /100 | #111 | Exceptional 49.1% |
| Immigrants | Chile | 95.3 /100 | #112 | Exceptional 49.0% |
| Palestinians | 95.3 /100 | #113 | Exceptional 49.0% |
| Arabs | 95.3 /100 | #114 | Exceptional 49.0% |
| Luxembourgers | 95.1 /100 | #115 | Exceptional 48.9% |
| British | 95.0 /100 | #116 | Exceptional 48.9% |
| Afghans | 94.8 /100 | #117 | Exceptional 48.9% |
| Albanians | 94.7 /100 | #118 | Exceptional 48.8% |
| Lebanese | 94.6 /100 | #119 | Exceptional 48.8% |
| Alsatians | 94.6 /100 | #120 | Exceptional 48.8% |
| Ugandans | 93.9 /100 | #121 | Exceptional 48.7% |
| Italians | 93.9 /100 | #122 | Exceptional 48.7% |
| Brazilians | 93.7 /100 | #123 | Exceptional 48.7% |
Demographics Similar to Pennsylvania Germans by Associate's Degree
In terms of associate's degree, the demographic groups most similar to Pennsylvania Germans are Immigrants from Yemen (37.3%, a difference of 0.29%), Cajun (37.4%, a difference of 0.40%), Fijian (37.4%, a difference of 0.43%), Alaska Native (37.5%, a difference of 0.66%), and Yaqui (37.6%, a difference of 0.89%).
| Demographics | Rating | Rank | Associate's Degree |
| Creek | 0.0 /100 | #315 | Tragic 37.6% |
| Crow | 0.0 /100 | #316 | Tragic 37.6% |
| Yaqui | 0.0 /100 | #317 | Tragic 37.6% |
| Alaska Natives | 0.0 /100 | #318 | Tragic 37.5% |
| Fijians | 0.0 /100 | #319 | Tragic 37.4% |
| Cajuns | 0.0 /100 | #320 | Tragic 37.4% |
| Immigrants | Yemen | 0.0 /100 | #321 | Tragic 37.3% |
| Pennsylvania Germans | 0.0 /100 | #322 | Tragic 37.2% |
| Immigrants | Cabo Verde | 0.0 /100 | #323 | Tragic 36.8% |
| Arapaho | 0.0 /100 | #324 | Tragic 36.7% |
| Menominee | 0.0 /100 | #325 | Tragic 36.7% |
| Kiowa | 0.0 /100 | #326 | Tragic 36.5% |
| Dutch West Indians | 0.0 /100 | #327 | Tragic 36.5% |
| Alaskan Athabascans | 0.0 /100 | #328 | Tragic 36.5% |
| Paiute | 0.0 /100 | #329 | Tragic 36.4% |