British vs Immigrants from Switzerland Male Disability
COMPARE
British
Immigrants from Switzerland
Male Disability
Male Disability Comparison
British
Immigrants from Switzerland
12.1%
MALE DISABILITY
0.4/ 100
METRIC RATING
254th/ 347
METRIC RANK
10.7%
MALE DISABILITY
96.1/ 100
METRIC RATING
99th/ 347
METRIC RANK
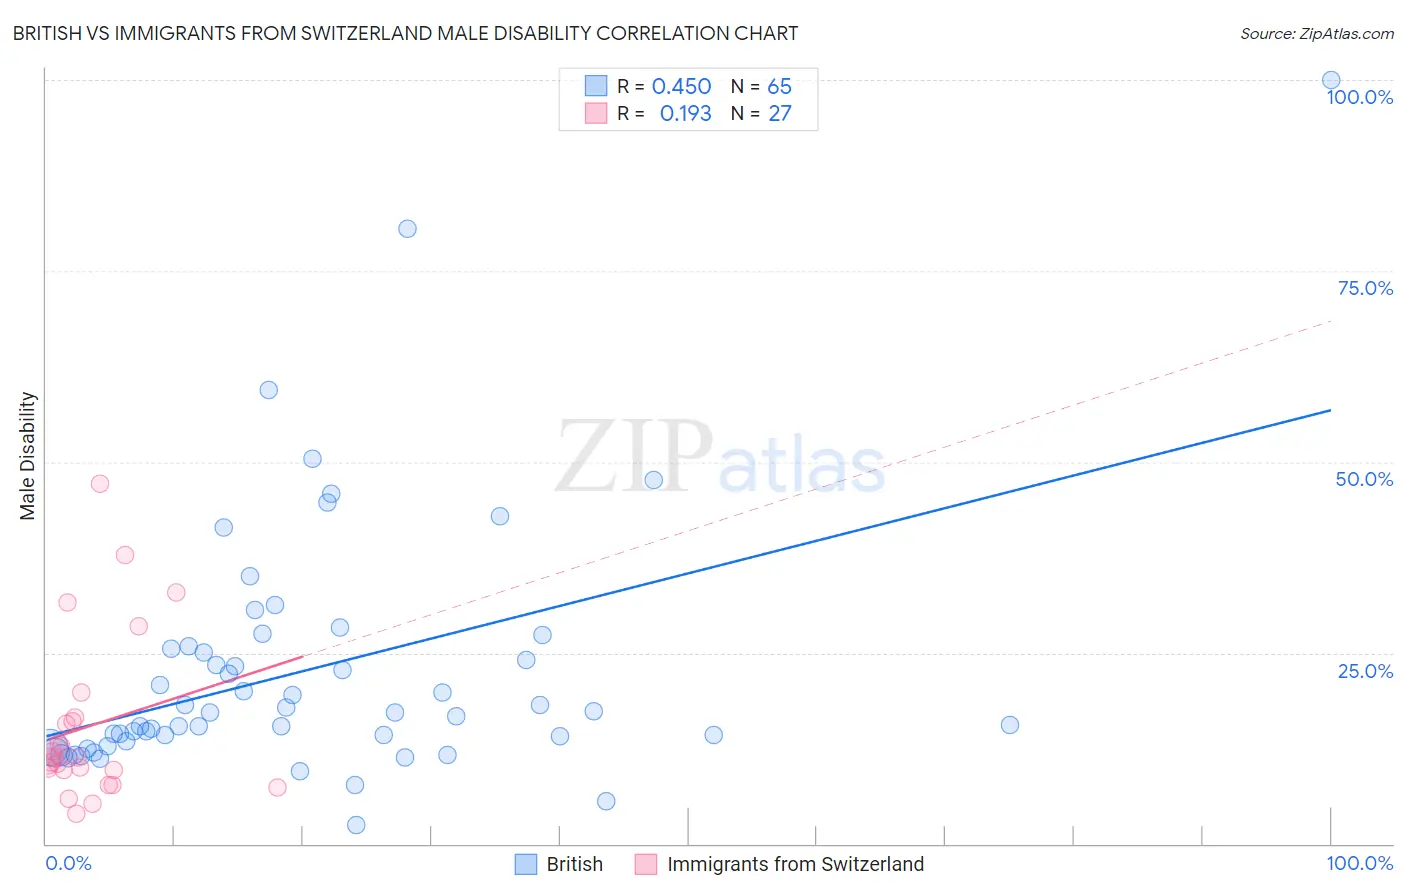
British vs Immigrants from Switzerland Male Disability Correlation Chart
The statistical analysis conducted on geographies consisting of 531,329,993 people shows a moderate positive correlation between the proportion of British and percentage of males with a disability in the United States with a correlation coefficient (R) of 0.450 and weighted average of 12.1%. Similarly, the statistical analysis conducted on geographies consisting of 148,082,366 people shows a poor positive correlation between the proportion of Immigrants from Switzerland and percentage of males with a disability in the United States with a correlation coefficient (R) of 0.193 and weighted average of 10.7%, a difference of 12.5%.
Male Disability Correlation Summary
| Measurement | British | Immigrants from Switzerland |
| Minimum | 2.5% | 4.0% |
| Maximum | 100.0% | 47.1% |
| Range | 97.5% | 43.1% |
| Mean | 22.7% | 15.4% |
| Median | 17.1% | 11.3% |
| Interquartile 25% (IQ1) | 13.2% | 9.6% |
| Interquartile 75% (IQ3) | 25.7% | 16.6% |
| Interquartile Range (IQR) | 12.5% | 7.0% |
| Standard Deviation (Sample) | 16.7% | 10.8% |
| Standard Deviation (Population) | 16.6% | 10.6% |
Similar Demographics by Male Disability
Demographics Similar to British by Male Disability
In terms of male disability, the demographic groups most similar to British are Chinese (12.1%, a difference of 0.010%), Guamanian/Chamorro (12.0%, a difference of 0.18%), Slovene (12.0%, a difference of 0.19%), German Russian (12.0%, a difference of 0.26%), and Swiss (12.1%, a difference of 0.26%).
| Demographics | Rating | Rank | Male Disability |
| Hungarians | 0.8 /100 | #247 | Tragic 12.0% |
| Poles | 0.7 /100 | #248 | Tragic 12.0% |
| Immigrants | Yemen | 0.5 /100 | #249 | Tragic 12.0% |
| Bangladeshis | 0.5 /100 | #250 | Tragic 12.0% |
| German Russians | 0.5 /100 | #251 | Tragic 12.0% |
| Slovenes | 0.5 /100 | #252 | Tragic 12.0% |
| Guamanians/Chamorros | 0.5 /100 | #253 | Tragic 12.0% |
| British | 0.4 /100 | #254 | Tragic 12.1% |
| Chinese | 0.4 /100 | #255 | Tragic 12.1% |
| Swiss | 0.3 /100 | #256 | Tragic 12.1% |
| Europeans | 0.3 /100 | #257 | Tragic 12.1% |
| Basques | 0.3 /100 | #258 | Tragic 12.1% |
| Belgians | 0.3 /100 | #259 | Tragic 12.1% |
| Swedes | 0.3 /100 | #260 | Tragic 12.1% |
| Slavs | 0.2 /100 | #261 | Tragic 12.2% |
Demographics Similar to Immigrants from Switzerland by Male Disability
In terms of male disability, the demographic groups most similar to Immigrants from Switzerland are Immigrants from Kazakhstan (10.7%, a difference of 0.070%), Immigrants from Romania (10.7%, a difference of 0.14%), Immigrants from Greece (10.7%, a difference of 0.18%), Immigrants from Armenia (10.7%, a difference of 0.20%), and Nicaraguan (10.7%, a difference of 0.22%).
| Demographics | Rating | Rank | Male Disability |
| Palestinians | 97.4 /100 | #92 | Exceptional 10.7% |
| Immigrants | St. Vincent and the Grenadines | 97.1 /100 | #93 | Exceptional 10.7% |
| Immigrants | Sweden | 96.9 /100 | #94 | Exceptional 10.7% |
| Chileans | 96.9 /100 | #95 | Exceptional 10.7% |
| Nicaraguans | 96.6 /100 | #96 | Exceptional 10.7% |
| Immigrants | Armenia | 96.6 /100 | #97 | Exceptional 10.7% |
| Immigrants | Romania | 96.5 /100 | #98 | Exceptional 10.7% |
| Immigrants | Switzerland | 96.1 /100 | #99 | Exceptional 10.7% |
| Immigrants | Kazakhstan | 95.9 /100 | #100 | Exceptional 10.7% |
| Immigrants | Greece | 95.6 /100 | #101 | Exceptional 10.7% |
| Immigrants | Eastern Europe | 95.3 /100 | #102 | Exceptional 10.7% |
| Uruguayans | 95.3 /100 | #103 | Exceptional 10.7% |
| Immigrants | Nigeria | 95.1 /100 | #104 | Exceptional 10.8% |
| Immigrants | Brazil | 95.0 /100 | #105 | Exceptional 10.8% |
| Immigrants | Syria | 94.9 /100 | #106 | Exceptional 10.8% |