British vs Immigrants from Oceania Hearing Disability
COMPARE
British
Immigrants from Oceania
Hearing Disability
Hearing Disability Comparison
British
Immigrants from Oceania
3.5%
HEARING DISABILITY
0.1/ 100
METRIC RATING
265th/ 347
METRIC RANK
3.2%
HEARING DISABILITY
6.5/ 100
METRIC RATING
222nd/ 347
METRIC RANK
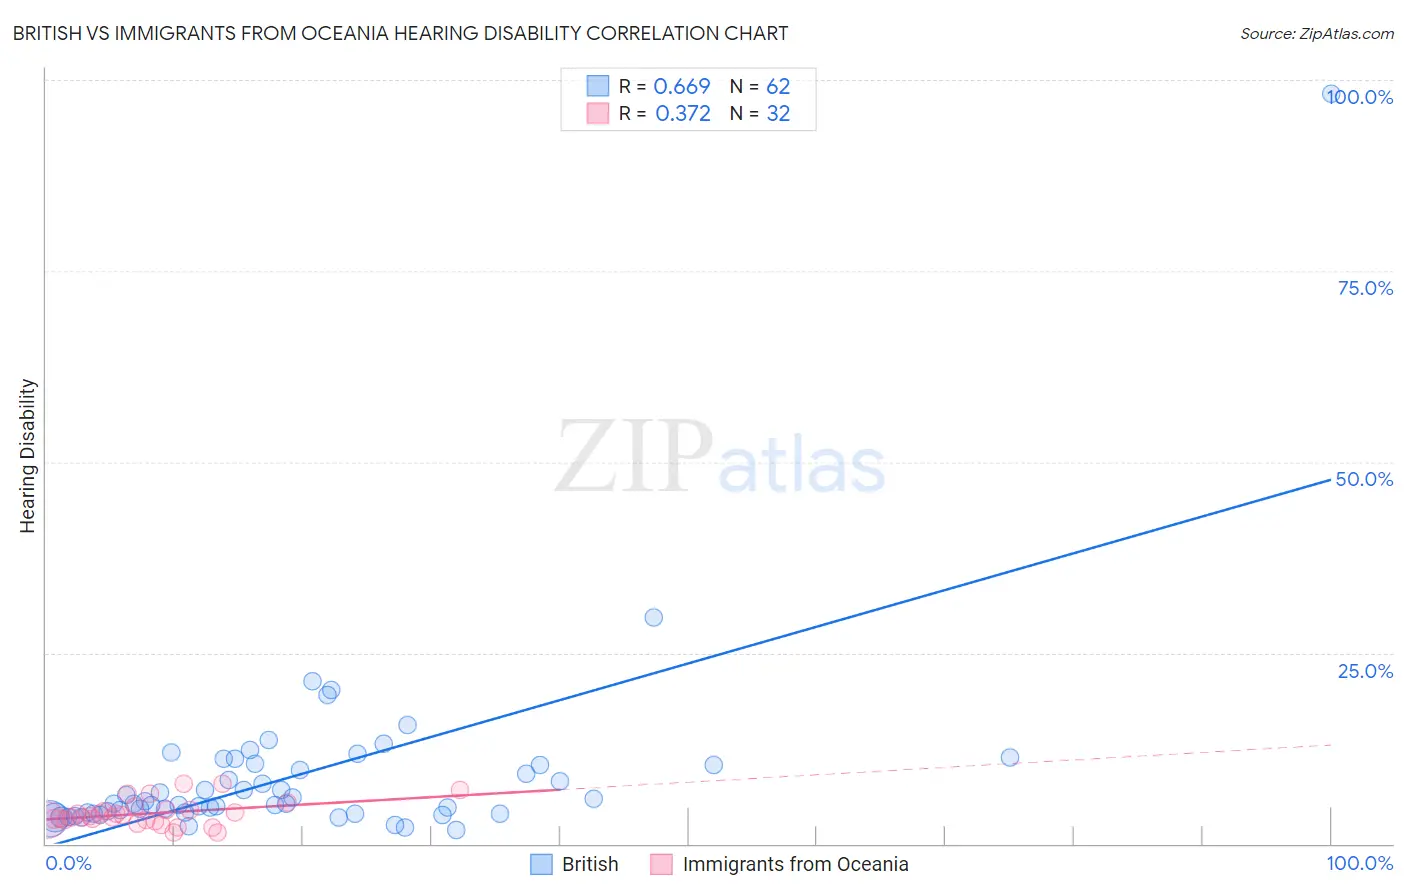
British vs Immigrants from Oceania Hearing Disability Correlation Chart
The statistical analysis conducted on geographies consisting of 531,095,023 people shows a significant positive correlation between the proportion of British and percentage of population with hearing disability in the United States with a correlation coefficient (R) of 0.669 and weighted average of 3.5%. Similarly, the statistical analysis conducted on geographies consisting of 305,402,457 people shows a mild positive correlation between the proportion of Immigrants from Oceania and percentage of population with hearing disability in the United States with a correlation coefficient (R) of 0.372 and weighted average of 3.2%, a difference of 9.2%.
Hearing Disability Correlation Summary
| Measurement | British | Immigrants from Oceania |
| Minimum | 1.8% | 1.4% |
| Maximum | 98.2% | 7.9% |
| Range | 96.4% | 6.5% |
| Mean | 8.9% | 4.0% |
| Median | 5.3% | 3.6% |
| Interquartile 25% (IQ1) | 4.0% | 3.1% |
| Interquartile 75% (IQ3) | 10.4% | 4.4% |
| Interquartile Range (IQR) | 6.4% | 1.3% |
| Standard Deviation (Sample) | 12.7% | 1.7% |
| Standard Deviation (Population) | 12.6% | 1.6% |
Similar Demographics by Hearing Disability
Demographics Similar to British by Hearing Disability
In terms of hearing disability, the demographic groups most similar to British are Immigrants from Germany (3.5%, a difference of 0.020%), Belgian (3.5%, a difference of 0.18%), Immigrants from Canada (3.5%, a difference of 0.24%), Immigrants from North America (3.5%, a difference of 0.28%), and Hawaiian (3.5%, a difference of 0.39%).
| Demographics | Rating | Rank | Hearing Disability |
| Northern Europeans | 0.2 /100 | #258 | Tragic 3.4% |
| Slovenes | 0.1 /100 | #259 | Tragic 3.5% |
| Portuguese | 0.1 /100 | #260 | Tragic 3.5% |
| Hawaiians | 0.1 /100 | #261 | Tragic 3.5% |
| Immigrants | North America | 0.1 /100 | #262 | Tragic 3.5% |
| Immigrants | Canada | 0.1 /100 | #263 | Tragic 3.5% |
| Immigrants | Germany | 0.1 /100 | #264 | Tragic 3.5% |
| British | 0.1 /100 | #265 | Tragic 3.5% |
| Belgians | 0.1 /100 | #266 | Tragic 3.5% |
| Canadians | 0.1 /100 | #267 | Tragic 3.5% |
| Spaniards | 0.1 /100 | #268 | Tragic 3.5% |
| Ute | 0.1 /100 | #269 | Tragic 3.5% |
| Europeans | 0.1 /100 | #270 | Tragic 3.5% |
| Czechs | 0.1 /100 | #271 | Tragic 3.5% |
| Fijians | 0.0 /100 | #272 | Tragic 3.5% |
Demographics Similar to Immigrants from Oceania by Hearing Disability
In terms of hearing disability, the demographic groups most similar to Immigrants from Oceania are Malaysian (3.2%, a difference of 0.040%), Immigrants from Laos (3.2%, a difference of 0.040%), New Zealander (3.2%, a difference of 0.10%), Immigrants from Northern Europe (3.2%, a difference of 0.16%), and Russian (3.2%, a difference of 0.20%).
| Demographics | Rating | Rank | Hearing Disability |
| Bangladeshis | 8.1 /100 | #215 | Tragic 3.2% |
| Immigrants | Norway | 7.3 /100 | #216 | Tragic 3.2% |
| Russians | 7.1 /100 | #217 | Tragic 3.2% |
| Immigrants | Northern Europe | 7.0 /100 | #218 | Tragic 3.2% |
| New Zealanders | 6.8 /100 | #219 | Tragic 3.2% |
| Malaysians | 6.6 /100 | #220 | Tragic 3.2% |
| Immigrants | Laos | 6.6 /100 | #221 | Tragic 3.2% |
| Immigrants | Oceania | 6.5 /100 | #222 | Tragic 3.2% |
| Mexicans | 5.6 /100 | #223 | Tragic 3.2% |
| Icelanders | 5.2 /100 | #224 | Tragic 3.2% |
| Latvians | 5.1 /100 | #225 | Tragic 3.2% |
| Lebanese | 5.0 /100 | #226 | Tragic 3.2% |
| Bhutanese | 4.6 /100 | #227 | Tragic 3.2% |
| Immigrants | Portugal | 4.3 /100 | #228 | Tragic 3.2% |
| Maltese | 4.1 /100 | #229 | Tragic 3.2% |