British vs Immigrants from Kazakhstan Hearing Disability
COMPARE
British
Immigrants from Kazakhstan
Hearing Disability
Hearing Disability Comparison
British
Immigrants from Kazakhstan
3.5%
HEARING DISABILITY
0.1/ 100
METRIC RATING
265th/ 347
METRIC RANK
2.9%
HEARING DISABILITY
69.6/ 100
METRIC RATING
157th/ 347
METRIC RANK
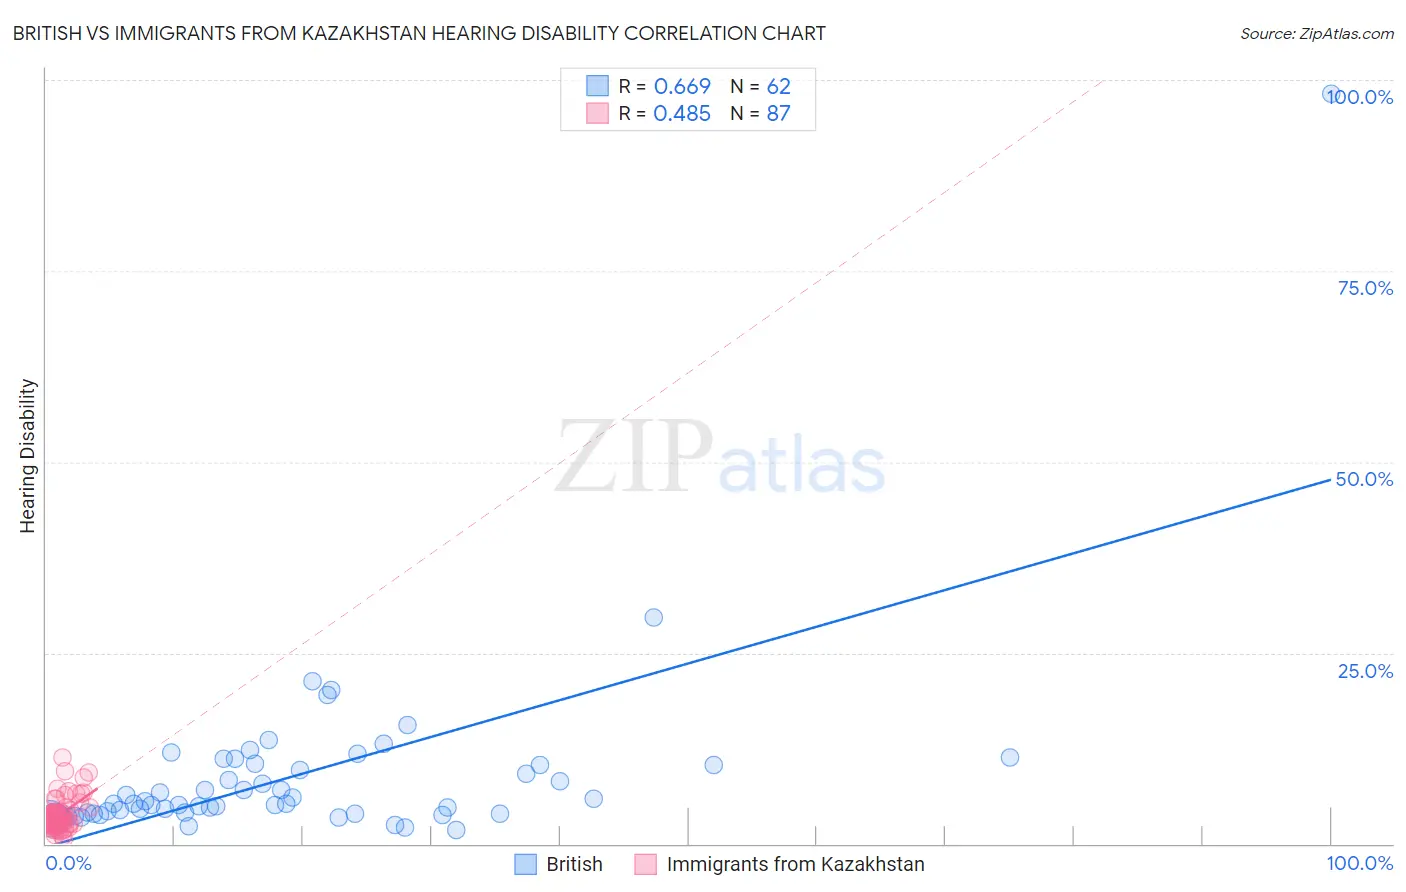
British vs Immigrants from Kazakhstan Hearing Disability Correlation Chart
The statistical analysis conducted on geographies consisting of 531,095,023 people shows a significant positive correlation between the proportion of British and percentage of population with hearing disability in the United States with a correlation coefficient (R) of 0.669 and weighted average of 3.5%. Similarly, the statistical analysis conducted on geographies consisting of 124,435,235 people shows a moderate positive correlation between the proportion of Immigrants from Kazakhstan and percentage of population with hearing disability in the United States with a correlation coefficient (R) of 0.485 and weighted average of 2.9%, a difference of 18.3%.
Hearing Disability Correlation Summary
| Measurement | British | Immigrants from Kazakhstan |
| Minimum | 1.8% | 0.67% |
| Maximum | 98.2% | 11.3% |
| Range | 96.4% | 10.6% |
| Mean | 8.9% | 3.6% |
| Median | 5.3% | 3.1% |
| Interquartile 25% (IQ1) | 4.0% | 2.6% |
| Interquartile 75% (IQ3) | 10.4% | 4.0% |
| Interquartile Range (IQR) | 6.4% | 1.3% |
| Standard Deviation (Sample) | 12.7% | 1.9% |
| Standard Deviation (Population) | 12.6% | 1.9% |
Similar Demographics by Hearing Disability
Demographics Similar to British by Hearing Disability
In terms of hearing disability, the demographic groups most similar to British are Immigrants from Germany (3.5%, a difference of 0.020%), Belgian (3.5%, a difference of 0.18%), Immigrants from Canada (3.5%, a difference of 0.24%), Immigrants from North America (3.5%, a difference of 0.28%), and Hawaiian (3.5%, a difference of 0.39%).
| Demographics | Rating | Rank | Hearing Disability |
| Northern Europeans | 0.2 /100 | #258 | Tragic 3.4% |
| Slovenes | 0.1 /100 | #259 | Tragic 3.5% |
| Portuguese | 0.1 /100 | #260 | Tragic 3.5% |
| Hawaiians | 0.1 /100 | #261 | Tragic 3.5% |
| Immigrants | North America | 0.1 /100 | #262 | Tragic 3.5% |
| Immigrants | Canada | 0.1 /100 | #263 | Tragic 3.5% |
| Immigrants | Germany | 0.1 /100 | #264 | Tragic 3.5% |
| British | 0.1 /100 | #265 | Tragic 3.5% |
| Belgians | 0.1 /100 | #266 | Tragic 3.5% |
| Canadians | 0.1 /100 | #267 | Tragic 3.5% |
| Spaniards | 0.1 /100 | #268 | Tragic 3.5% |
| Ute | 0.1 /100 | #269 | Tragic 3.5% |
| Europeans | 0.1 /100 | #270 | Tragic 3.5% |
| Czechs | 0.1 /100 | #271 | Tragic 3.5% |
| Fijians | 0.0 /100 | #272 | Tragic 3.5% |
Demographics Similar to Immigrants from Kazakhstan by Hearing Disability
In terms of hearing disability, the demographic groups most similar to Immigrants from Kazakhstan are Immigrants from Burma/Myanmar (2.9%, a difference of 0.010%), Immigrants from Poland (2.9%, a difference of 0.070%), Costa Rican (2.9%, a difference of 0.21%), Immigrants from Lebanon (2.9%, a difference of 0.22%), and Immigrants from Australia (2.9%, a difference of 0.25%).
| Demographics | Rating | Rank | Hearing Disability |
| Palestinians | 73.6 /100 | #150 | Good 2.9% |
| Immigrants | France | 73.1 /100 | #151 | Good 2.9% |
| Immigrants | Lithuania | 73.0 /100 | #152 | Good 2.9% |
| Sudanese | 72.1 /100 | #153 | Good 2.9% |
| Immigrants | Lebanon | 71.5 /100 | #154 | Good 2.9% |
| Costa Ricans | 71.4 /100 | #155 | Good 2.9% |
| Immigrants | Poland | 70.2 /100 | #156 | Good 2.9% |
| Immigrants | Kazakhstan | 69.6 /100 | #157 | Good 2.9% |
| Immigrants | Burma/Myanmar | 69.5 /100 | #158 | Good 2.9% |
| Immigrants | Australia | 67.4 /100 | #159 | Good 2.9% |
| Immigrants | Fiji | 67.1 /100 | #160 | Good 2.9% |
| Albanians | 66.6 /100 | #161 | Good 2.9% |
| Immigrants | Japan | 66.3 /100 | #162 | Good 2.9% |
| Immigrants | Central America | 64.9 /100 | #163 | Good 3.0% |
| Immigrants | Cambodia | 64.8 /100 | #164 | Good 3.0% |