Pima vs Immigrants from Oceania Hearing Disability
COMPARE
Pima
Immigrants from Oceania
Hearing Disability
Hearing Disability Comparison
Pima
Immigrants from Oceania
3.7%
HEARING DISABILITY
0.0/ 100
METRIC RATING
296th/ 347
METRIC RANK
3.2%
HEARING DISABILITY
6.5/ 100
METRIC RATING
222nd/ 347
METRIC RANK
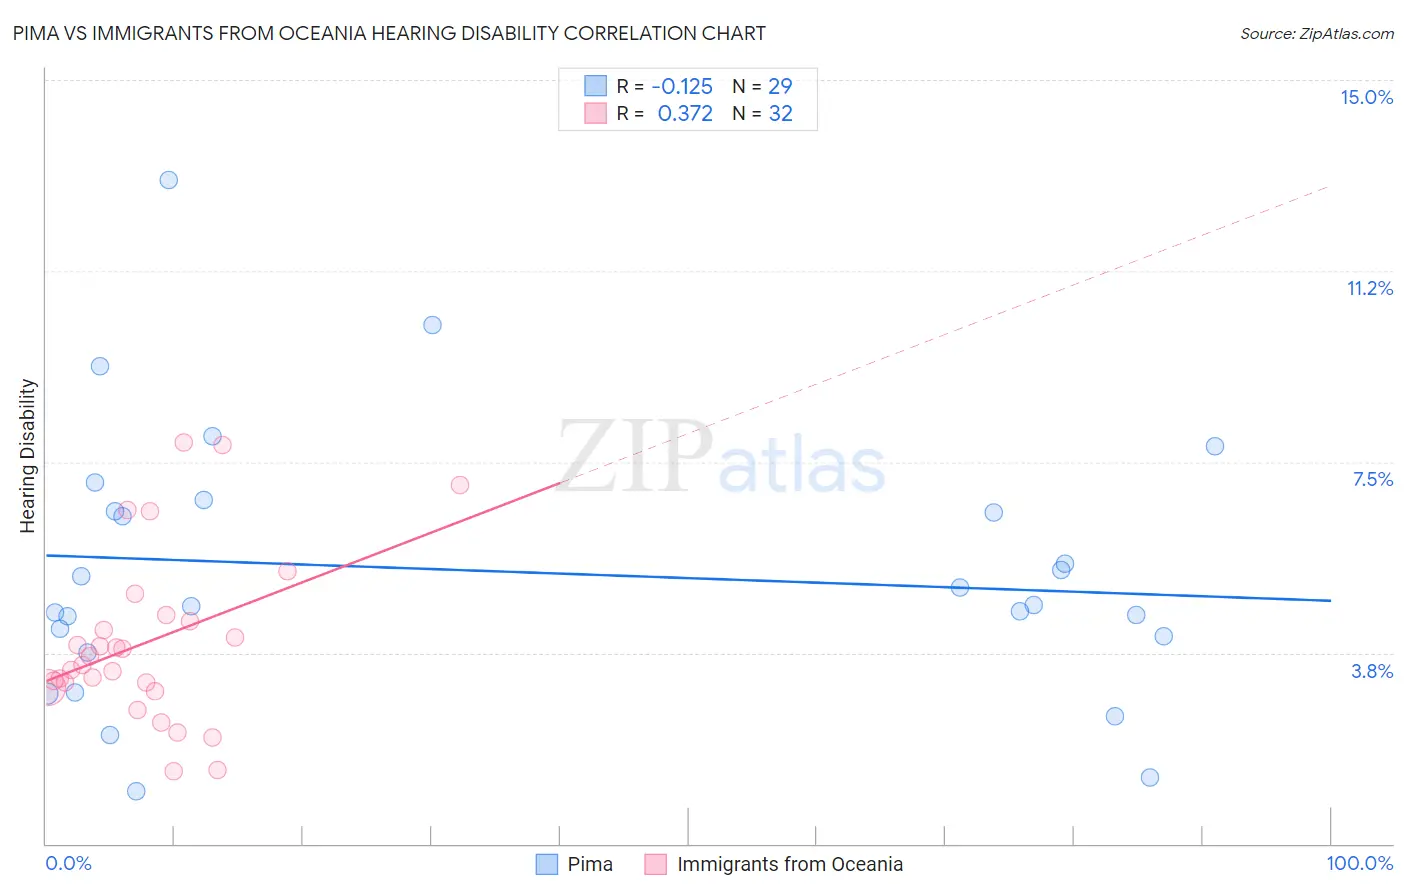
Pima vs Immigrants from Oceania Hearing Disability Correlation Chart
The statistical analysis conducted on geographies consisting of 61,536,530 people shows a poor negative correlation between the proportion of Pima and percentage of population with hearing disability in the United States with a correlation coefficient (R) of -0.125 and weighted average of 3.7%. Similarly, the statistical analysis conducted on geographies consisting of 305,402,457 people shows a mild positive correlation between the proportion of Immigrants from Oceania and percentage of population with hearing disability in the United States with a correlation coefficient (R) of 0.372 and weighted average of 3.2%, a difference of 16.7%.
Hearing Disability Correlation Summary
| Measurement | Pima | Immigrants from Oceania |
| Minimum | 1.0% | 1.4% |
| Maximum | 13.0% | 7.9% |
| Range | 12.0% | 6.5% |
| Mean | 5.4% | 4.0% |
| Median | 4.7% | 3.6% |
| Interquartile 25% (IQ1) | 3.9% | 3.1% |
| Interquartile 75% (IQ3) | 6.6% | 4.4% |
| Interquartile Range (IQR) | 2.7% | 1.3% |
| Standard Deviation (Sample) | 2.6% | 1.7% |
| Standard Deviation (Population) | 2.6% | 1.6% |
Similar Demographics by Hearing Disability
Demographics Similar to Pima by Hearing Disability
In terms of hearing disability, the demographic groups most similar to Pima are Immigrants from the Azores (3.7%, a difference of 0.070%), Welsh (3.7%, a difference of 0.13%), Celtic (3.7%, a difference of 0.26%), Iroquois (3.7%, a difference of 0.39%), and German (3.7%, a difference of 0.54%).
| Demographics | Rating | Rank | Hearing Disability |
| Chinese | 0.0 /100 | #289 | Tragic 3.7% |
| Whites/Caucasians | 0.0 /100 | #290 | Tragic 3.7% |
| Finns | 0.0 /100 | #291 | Tragic 3.7% |
| Native Hawaiians | 0.0 /100 | #292 | Tragic 3.7% |
| Norwegians | 0.0 /100 | #293 | Tragic 3.7% |
| Iroquois | 0.0 /100 | #294 | Tragic 3.7% |
| Welsh | 0.0 /100 | #295 | Tragic 3.7% |
| Pima | 0.0 /100 | #296 | Tragic 3.7% |
| Immigrants | Azores | 0.0 /100 | #297 | Tragic 3.7% |
| Celtics | 0.0 /100 | #298 | Tragic 3.7% |
| Germans | 0.0 /100 | #299 | Tragic 3.7% |
| Scottish | 0.0 /100 | #300 | Tragic 3.7% |
| Pennsylvania Germans | 0.0 /100 | #301 | Tragic 3.7% |
| Dutch | 0.0 /100 | #302 | Tragic 3.7% |
| Menominee | 0.0 /100 | #303 | Tragic 3.7% |
Demographics Similar to Immigrants from Oceania by Hearing Disability
In terms of hearing disability, the demographic groups most similar to Immigrants from Oceania are Malaysian (3.2%, a difference of 0.040%), Immigrants from Laos (3.2%, a difference of 0.040%), New Zealander (3.2%, a difference of 0.10%), Immigrants from Northern Europe (3.2%, a difference of 0.16%), and Russian (3.2%, a difference of 0.20%).
| Demographics | Rating | Rank | Hearing Disability |
| Bangladeshis | 8.1 /100 | #215 | Tragic 3.2% |
| Immigrants | Norway | 7.3 /100 | #216 | Tragic 3.2% |
| Russians | 7.1 /100 | #217 | Tragic 3.2% |
| Immigrants | Northern Europe | 7.0 /100 | #218 | Tragic 3.2% |
| New Zealanders | 6.8 /100 | #219 | Tragic 3.2% |
| Malaysians | 6.6 /100 | #220 | Tragic 3.2% |
| Immigrants | Laos | 6.6 /100 | #221 | Tragic 3.2% |
| Immigrants | Oceania | 6.5 /100 | #222 | Tragic 3.2% |
| Mexicans | 5.6 /100 | #223 | Tragic 3.2% |
| Icelanders | 5.2 /100 | #224 | Tragic 3.2% |
| Latvians | 5.1 /100 | #225 | Tragic 3.2% |
| Lebanese | 5.0 /100 | #226 | Tragic 3.2% |
| Bhutanese | 4.6 /100 | #227 | Tragic 3.2% |
| Immigrants | Portugal | 4.3 /100 | #228 | Tragic 3.2% |
| Maltese | 4.1 /100 | #229 | Tragic 3.2% |