British vs Immigrants from Dominica Hearing Disability
COMPARE
British
Immigrants from Dominica
Hearing Disability
Hearing Disability Comparison
British
Immigrants from Dominica
3.5%
HEARING DISABILITY
0.1/ 100
METRIC RATING
265th/ 347
METRIC RANK
2.6%
HEARING DISABILITY
99.3/ 100
METRIC RATING
46th/ 347
METRIC RANK
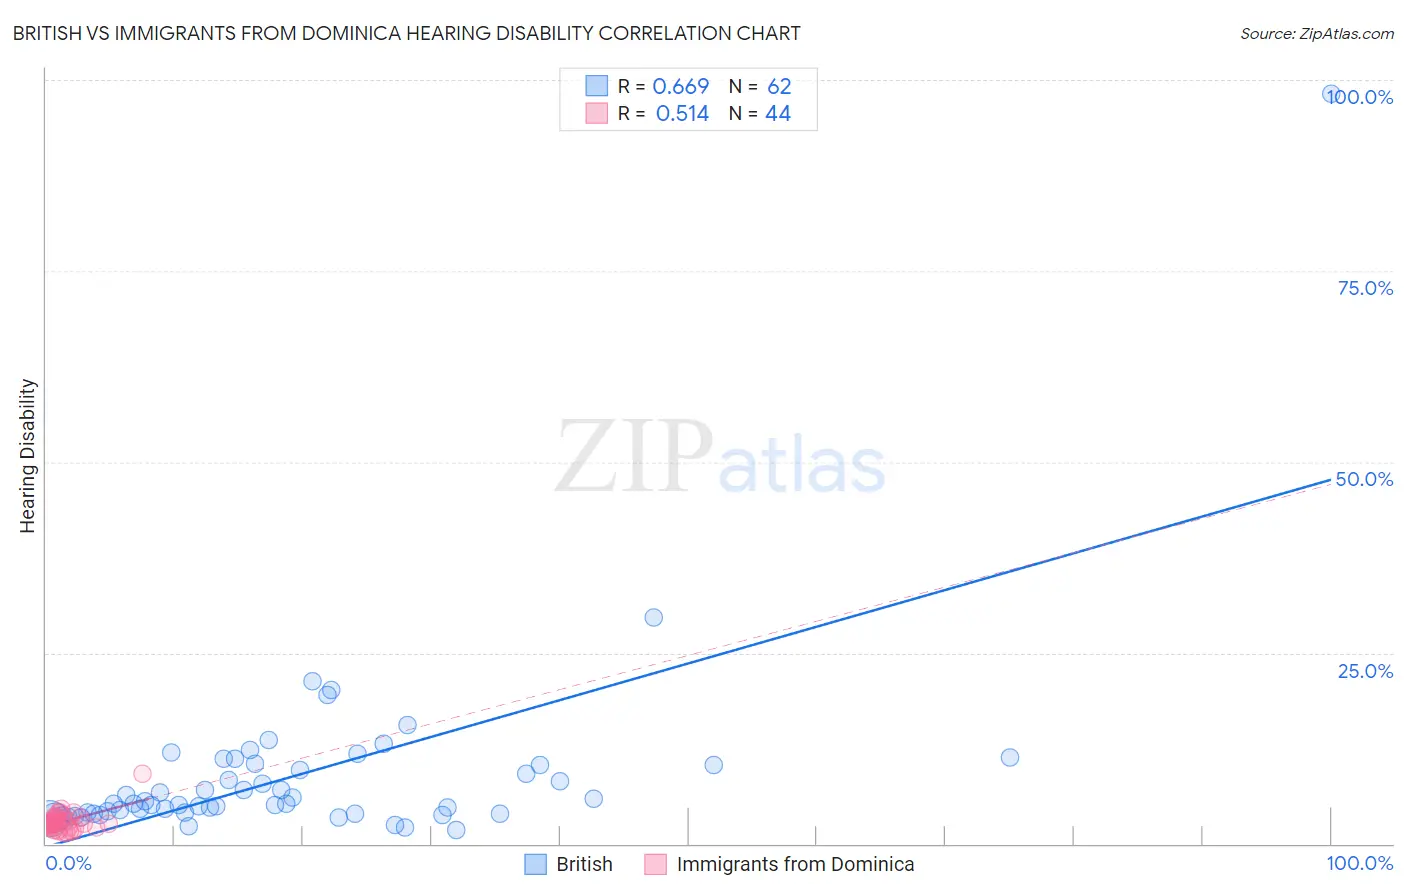
British vs Immigrants from Dominica Hearing Disability Correlation Chart
The statistical analysis conducted on geographies consisting of 531,095,023 people shows a significant positive correlation between the proportion of British and percentage of population with hearing disability in the United States with a correlation coefficient (R) of 0.669 and weighted average of 3.5%. Similarly, the statistical analysis conducted on geographies consisting of 83,776,076 people shows a substantial positive correlation between the proportion of Immigrants from Dominica and percentage of population with hearing disability in the United States with a correlation coefficient (R) of 0.514 and weighted average of 2.6%, a difference of 31.4%.
Hearing Disability Correlation Summary
| Measurement | British | Immigrants from Dominica |
| Minimum | 1.8% | 1.4% |
| Maximum | 98.2% | 9.1% |
| Range | 96.4% | 7.7% |
| Mean | 8.9% | 2.9% |
| Median | 5.3% | 2.7% |
| Interquartile 25% (IQ1) | 4.0% | 2.1% |
| Interquartile 75% (IQ3) | 10.4% | 3.2% |
| Interquartile Range (IQR) | 6.4% | 1.1% |
| Standard Deviation (Sample) | 12.7% | 1.2% |
| Standard Deviation (Population) | 12.6% | 1.2% |
Similar Demographics by Hearing Disability
Demographics Similar to British by Hearing Disability
In terms of hearing disability, the demographic groups most similar to British are Immigrants from Germany (3.5%, a difference of 0.020%), Belgian (3.5%, a difference of 0.18%), Immigrants from Canada (3.5%, a difference of 0.24%), Immigrants from North America (3.5%, a difference of 0.28%), and Hawaiian (3.5%, a difference of 0.39%).
| Demographics | Rating | Rank | Hearing Disability |
| Northern Europeans | 0.2 /100 | #258 | Tragic 3.4% |
| Slovenes | 0.1 /100 | #259 | Tragic 3.5% |
| Portuguese | 0.1 /100 | #260 | Tragic 3.5% |
| Hawaiians | 0.1 /100 | #261 | Tragic 3.5% |
| Immigrants | North America | 0.1 /100 | #262 | Tragic 3.5% |
| Immigrants | Canada | 0.1 /100 | #263 | Tragic 3.5% |
| Immigrants | Germany | 0.1 /100 | #264 | Tragic 3.5% |
| British | 0.1 /100 | #265 | Tragic 3.5% |
| Belgians | 0.1 /100 | #266 | Tragic 3.5% |
| Canadians | 0.1 /100 | #267 | Tragic 3.5% |
| Spaniards | 0.1 /100 | #268 | Tragic 3.5% |
| Ute | 0.1 /100 | #269 | Tragic 3.5% |
| Europeans | 0.1 /100 | #270 | Tragic 3.5% |
| Czechs | 0.1 /100 | #271 | Tragic 3.5% |
| Fijians | 0.0 /100 | #272 | Tragic 3.5% |
Demographics Similar to Immigrants from Dominica by Hearing Disability
In terms of hearing disability, the demographic groups most similar to Immigrants from Dominica are Venezuelan (2.6%, a difference of 0.10%), Nigerian (2.6%, a difference of 0.13%), Immigrants from Israel (2.6%, a difference of 0.15%), Immigrants from Singapore (2.6%, a difference of 0.21%), and Immigrants from South America (2.7%, a difference of 0.34%).
| Demographics | Rating | Rank | Hearing Disability |
| Immigrants | China | 99.5 /100 | #39 | Exceptional 2.6% |
| Haitians | 99.5 /100 | #40 | Exceptional 2.6% |
| Immigrants | Taiwan | 99.4 /100 | #41 | Exceptional 2.6% |
| West Indians | 99.4 /100 | #42 | Exceptional 2.6% |
| Senegalese | 99.4 /100 | #43 | Exceptional 2.6% |
| Nigerians | 99.4 /100 | #44 | Exceptional 2.6% |
| Venezuelans | 99.4 /100 | #45 | Exceptional 2.6% |
| Immigrants | Dominica | 99.3 /100 | #46 | Exceptional 2.6% |
| Immigrants | Israel | 99.3 /100 | #47 | Exceptional 2.6% |
| Immigrants | Singapore | 99.3 /100 | #48 | Exceptional 2.6% |
| Immigrants | South America | 99.2 /100 | #49 | Exceptional 2.7% |
| Paraguayans | 99.2 /100 | #50 | Exceptional 2.7% |
| Immigrants | Hong Kong | 99.2 /100 | #51 | Exceptional 2.7% |
| Jamaicans | 99.0 /100 | #52 | Exceptional 2.7% |
| Immigrants | Eastern Asia | 99.0 /100 | #53 | Exceptional 2.7% |