British vs Immigrants from North Macedonia Hearing Disability
COMPARE
British
Immigrants from North Macedonia
Hearing Disability
Hearing Disability Comparison
British
Immigrants from North Macedonia
3.5%
HEARING DISABILITY
0.1/ 100
METRIC RATING
265th/ 347
METRIC RANK
3.1%
HEARING DISABILITY
19.1/ 100
METRIC RATING
200th/ 347
METRIC RANK
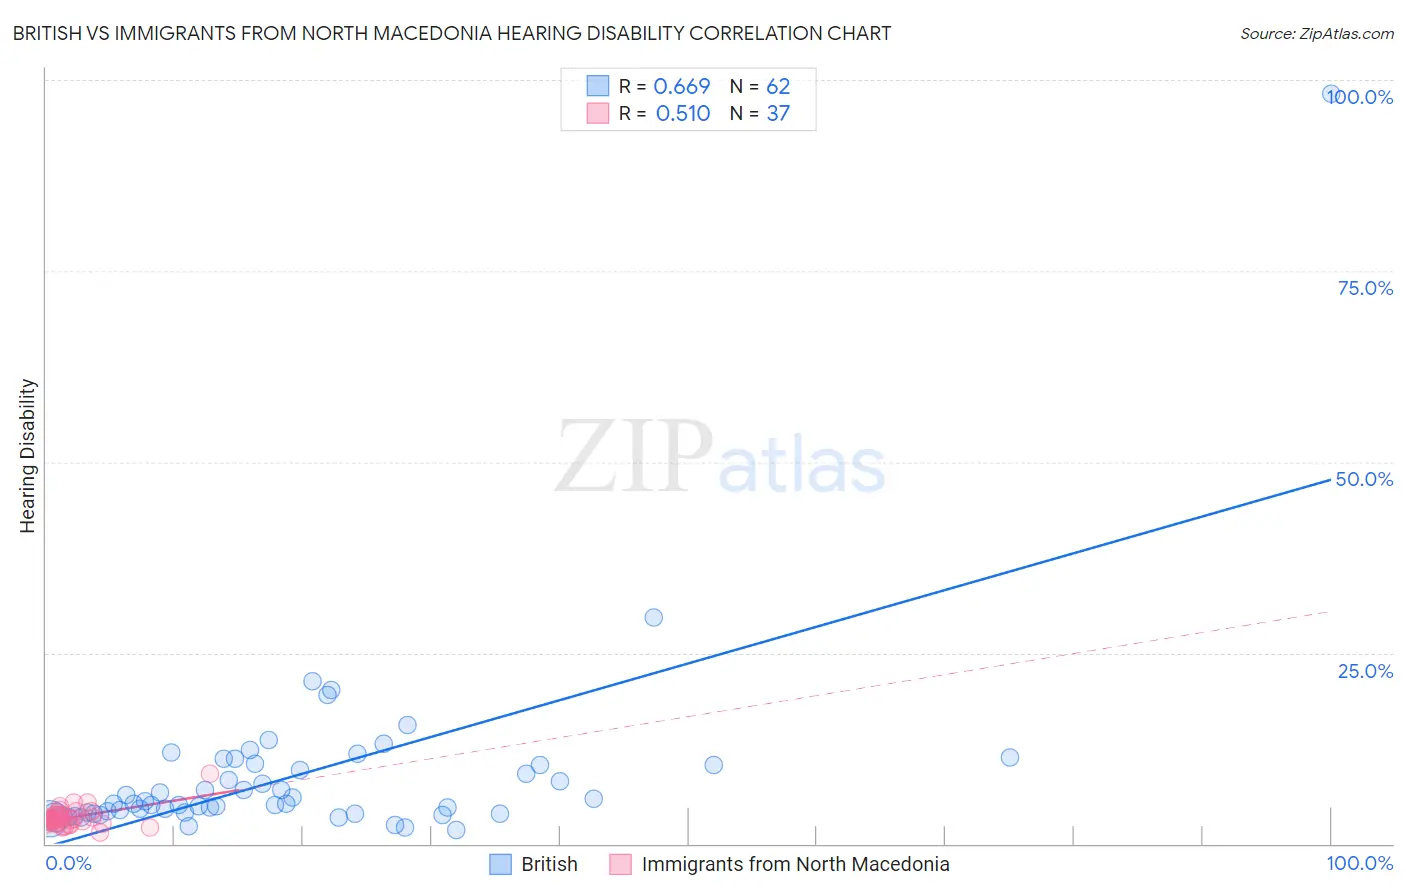
British vs Immigrants from North Macedonia Hearing Disability Correlation Chart
The statistical analysis conducted on geographies consisting of 531,095,023 people shows a significant positive correlation between the proportion of British and percentage of population with hearing disability in the United States with a correlation coefficient (R) of 0.669 and weighted average of 3.5%. Similarly, the statistical analysis conducted on geographies consisting of 74,314,151 people shows a substantial positive correlation between the proportion of Immigrants from North Macedonia and percentage of population with hearing disability in the United States with a correlation coefficient (R) of 0.510 and weighted average of 3.1%, a difference of 12.2%.
Hearing Disability Correlation Summary
| Measurement | British | Immigrants from North Macedonia |
| Minimum | 1.8% | 1.5% |
| Maximum | 98.2% | 9.2% |
| Range | 96.4% | 7.7% |
| Mean | 8.9% | 3.4% |
| Median | 5.3% | 3.2% |
| Interquartile 25% (IQ1) | 4.0% | 2.7% |
| Interquartile 75% (IQ3) | 10.4% | 3.8% |
| Interquartile Range (IQR) | 6.4% | 1.1% |
| Standard Deviation (Sample) | 12.7% | 1.3% |
| Standard Deviation (Population) | 12.6% | 1.3% |
Similar Demographics by Hearing Disability
Demographics Similar to British by Hearing Disability
In terms of hearing disability, the demographic groups most similar to British are Immigrants from Germany (3.5%, a difference of 0.020%), Belgian (3.5%, a difference of 0.18%), Immigrants from Canada (3.5%, a difference of 0.24%), Immigrants from North America (3.5%, a difference of 0.28%), and Hawaiian (3.5%, a difference of 0.39%).
| Demographics | Rating | Rank | Hearing Disability |
| Northern Europeans | 0.2 /100 | #258 | Tragic 3.4% |
| Slovenes | 0.1 /100 | #259 | Tragic 3.5% |
| Portuguese | 0.1 /100 | #260 | Tragic 3.5% |
| Hawaiians | 0.1 /100 | #261 | Tragic 3.5% |
| Immigrants | North America | 0.1 /100 | #262 | Tragic 3.5% |
| Immigrants | Canada | 0.1 /100 | #263 | Tragic 3.5% |
| Immigrants | Germany | 0.1 /100 | #264 | Tragic 3.5% |
| British | 0.1 /100 | #265 | Tragic 3.5% |
| Belgians | 0.1 /100 | #266 | Tragic 3.5% |
| Canadians | 0.1 /100 | #267 | Tragic 3.5% |
| Spaniards | 0.1 /100 | #268 | Tragic 3.5% |
| Ute | 0.1 /100 | #269 | Tragic 3.5% |
| Europeans | 0.1 /100 | #270 | Tragic 3.5% |
| Czechs | 0.1 /100 | #271 | Tragic 3.5% |
| Fijians | 0.0 /100 | #272 | Tragic 3.5% |
Demographics Similar to Immigrants from North Macedonia by Hearing Disability
In terms of hearing disability, the demographic groups most similar to Immigrants from North Macedonia are Syrian (3.1%, a difference of 0.010%), Iraqi (3.1%, a difference of 0.020%), Immigrants from Croatia (3.1%, a difference of 0.19%), Immigrants from Bosnia and Herzegovina (3.1%, a difference of 0.21%), and Immigrants from Thailand (3.1%, a difference of 0.42%).
| Demographics | Rating | Rank | Hearing Disability |
| Macedonians | 27.0 /100 | #193 | Fair 3.1% |
| South Africans | 24.5 /100 | #194 | Fair 3.1% |
| Spanish American Indians | 24.1 /100 | #195 | Fair 3.1% |
| Immigrants | Europe | 22.9 /100 | #196 | Fair 3.1% |
| Immigrants | Bosnia and Herzegovina | 20.6 /100 | #197 | Fair 3.1% |
| Immigrants | Croatia | 20.5 /100 | #198 | Fair 3.1% |
| Syrians | 19.2 /100 | #199 | Poor 3.1% |
| Immigrants | North Macedonia | 19.1 /100 | #200 | Poor 3.1% |
| Iraqis | 19.0 /100 | #201 | Poor 3.1% |
| Immigrants | Thailand | 16.4 /100 | #202 | Poor 3.1% |
| Immigrants | Denmark | 16.2 /100 | #203 | Poor 3.1% |
| Immigrants | Czechoslovakia | 15.9 /100 | #204 | Poor 3.1% |
| Alsatians | 15.9 /100 | #205 | Poor 3.1% |
| Eastern Europeans | 15.5 /100 | #206 | Poor 3.1% |
| Hispanics or Latinos | 15.1 /100 | #207 | Poor 3.1% |