Liberian vs Immigrants from Oceania Hearing Disability
COMPARE
Liberian
Immigrants from Oceania
Hearing Disability
Hearing Disability Comparison
Liberians
Immigrants from Oceania
2.8%
HEARING DISABILITY
89.0/ 100
METRIC RATING
122nd/ 347
METRIC RANK
3.2%
HEARING DISABILITY
6.5/ 100
METRIC RATING
222nd/ 347
METRIC RANK
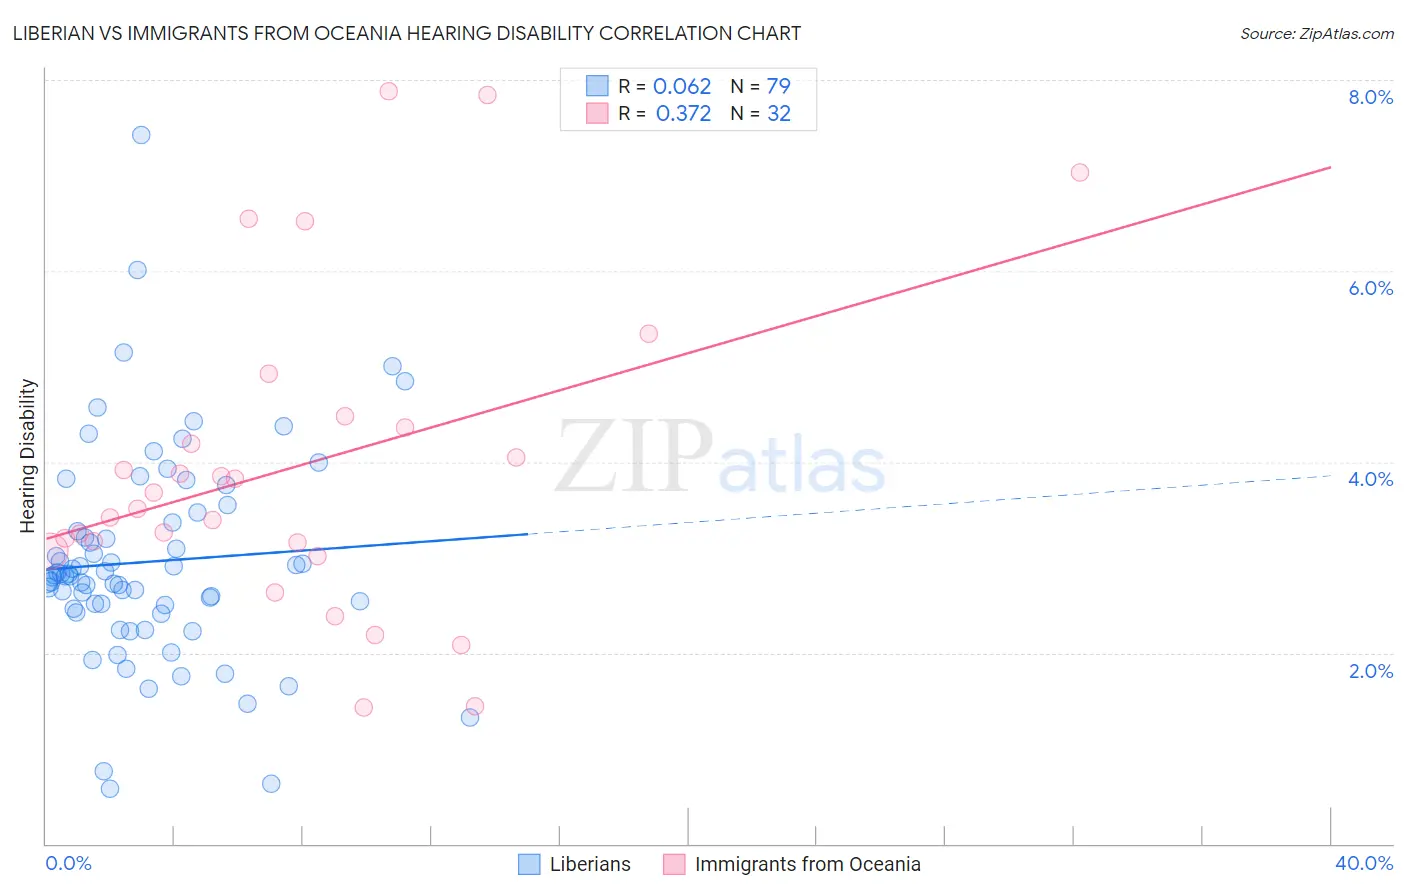
Liberian vs Immigrants from Oceania Hearing Disability Correlation Chart
The statistical analysis conducted on geographies consisting of 118,050,307 people shows a slight positive correlation between the proportion of Liberians and percentage of population with hearing disability in the United States with a correlation coefficient (R) of 0.062 and weighted average of 2.8%. Similarly, the statistical analysis conducted on geographies consisting of 305,402,457 people shows a mild positive correlation between the proportion of Immigrants from Oceania and percentage of population with hearing disability in the United States with a correlation coefficient (R) of 0.372 and weighted average of 3.2%, a difference of 11.7%.
Hearing Disability Correlation Summary
| Measurement | Liberian | Immigrants from Oceania |
| Minimum | 0.58% | 1.4% |
| Maximum | 7.4% | 7.9% |
| Range | 6.9% | 6.5% |
| Mean | 3.0% | 4.0% |
| Median | 2.8% | 3.6% |
| Interquartile 25% (IQ1) | 2.5% | 3.1% |
| Interquartile 75% (IQ3) | 3.4% | 4.4% |
| Interquartile Range (IQR) | 0.91% | 1.3% |
| Standard Deviation (Sample) | 1.1% | 1.7% |
| Standard Deviation (Population) | 1.1% | 1.6% |
Similar Demographics by Hearing Disability
Demographics Similar to Liberians by Hearing Disability
In terms of hearing disability, the demographic groups most similar to Liberians are Cuban (2.8%, a difference of 0.090%), Immigrants from Zaire (2.9%, a difference of 0.090%), Bahamian (2.9%, a difference of 0.10%), Jordanian (2.8%, a difference of 0.13%), and Immigrants from Albania (2.9%, a difference of 0.13%).
| Demographics | Rating | Rank | Hearing Disability |
| Immigrants | Latin America | 90.5 /100 | #115 | Exceptional 2.8% |
| Immigrants | Immigrants | 90.3 /100 | #116 | Exceptional 2.8% |
| Immigrants | Liberia | 90.0 /100 | #117 | Excellent 2.8% |
| Zimbabweans | 89.9 /100 | #118 | Excellent 2.8% |
| Kenyans | 89.8 /100 | #119 | Excellent 2.8% |
| Jordanians | 89.5 /100 | #120 | Excellent 2.8% |
| Cubans | 89.4 /100 | #121 | Excellent 2.8% |
| Liberians | 89.0 /100 | #122 | Excellent 2.8% |
| Immigrants | Zaire | 88.6 /100 | #123 | Excellent 2.9% |
| Bahamians | 88.6 /100 | #124 | Excellent 2.9% |
| Immigrants | Albania | 88.5 /100 | #125 | Excellent 2.9% |
| Immigrants | Sudan | 87.8 /100 | #126 | Excellent 2.9% |
| South American Indians | 86.9 /100 | #127 | Excellent 2.9% |
| Immigrants | Western Asia | 86.9 /100 | #128 | Excellent 2.9% |
| Immigrants | Uganda | 86.6 /100 | #129 | Excellent 2.9% |
Demographics Similar to Immigrants from Oceania by Hearing Disability
In terms of hearing disability, the demographic groups most similar to Immigrants from Oceania are Malaysian (3.2%, a difference of 0.040%), Immigrants from Laos (3.2%, a difference of 0.040%), New Zealander (3.2%, a difference of 0.10%), Immigrants from Northern Europe (3.2%, a difference of 0.16%), and Russian (3.2%, a difference of 0.20%).
| Demographics | Rating | Rank | Hearing Disability |
| Bangladeshis | 8.1 /100 | #215 | Tragic 3.2% |
| Immigrants | Norway | 7.3 /100 | #216 | Tragic 3.2% |
| Russians | 7.1 /100 | #217 | Tragic 3.2% |
| Immigrants | Northern Europe | 7.0 /100 | #218 | Tragic 3.2% |
| New Zealanders | 6.8 /100 | #219 | Tragic 3.2% |
| Malaysians | 6.6 /100 | #220 | Tragic 3.2% |
| Immigrants | Laos | 6.6 /100 | #221 | Tragic 3.2% |
| Immigrants | Oceania | 6.5 /100 | #222 | Tragic 3.2% |
| Mexicans | 5.6 /100 | #223 | Tragic 3.2% |
| Icelanders | 5.2 /100 | #224 | Tragic 3.2% |
| Latvians | 5.1 /100 | #225 | Tragic 3.2% |
| Lebanese | 5.0 /100 | #226 | Tragic 3.2% |
| Bhutanese | 4.6 /100 | #227 | Tragic 3.2% |
| Immigrants | Portugal | 4.3 /100 | #228 | Tragic 3.2% |
| Maltese | 4.1 /100 | #229 | Tragic 3.2% |