South American Indian vs Trinidadian and Tobagonian Disability Age 5 to 17
COMPARE
South American Indian
Trinidadian and Tobagonian
Disability Age 5 to 17
Disability Age 5 to 17 Comparison
South American Indians
Trinidadians and Tobagonians
5.5%
DISABILITY AGE 5 TO 17
89.3/ 100
METRIC RATING
141st/ 347
METRIC RANK
5.7%
DISABILITY AGE 5 TO 17
10.8/ 100
METRIC RATING
205th/ 347
METRIC RANK
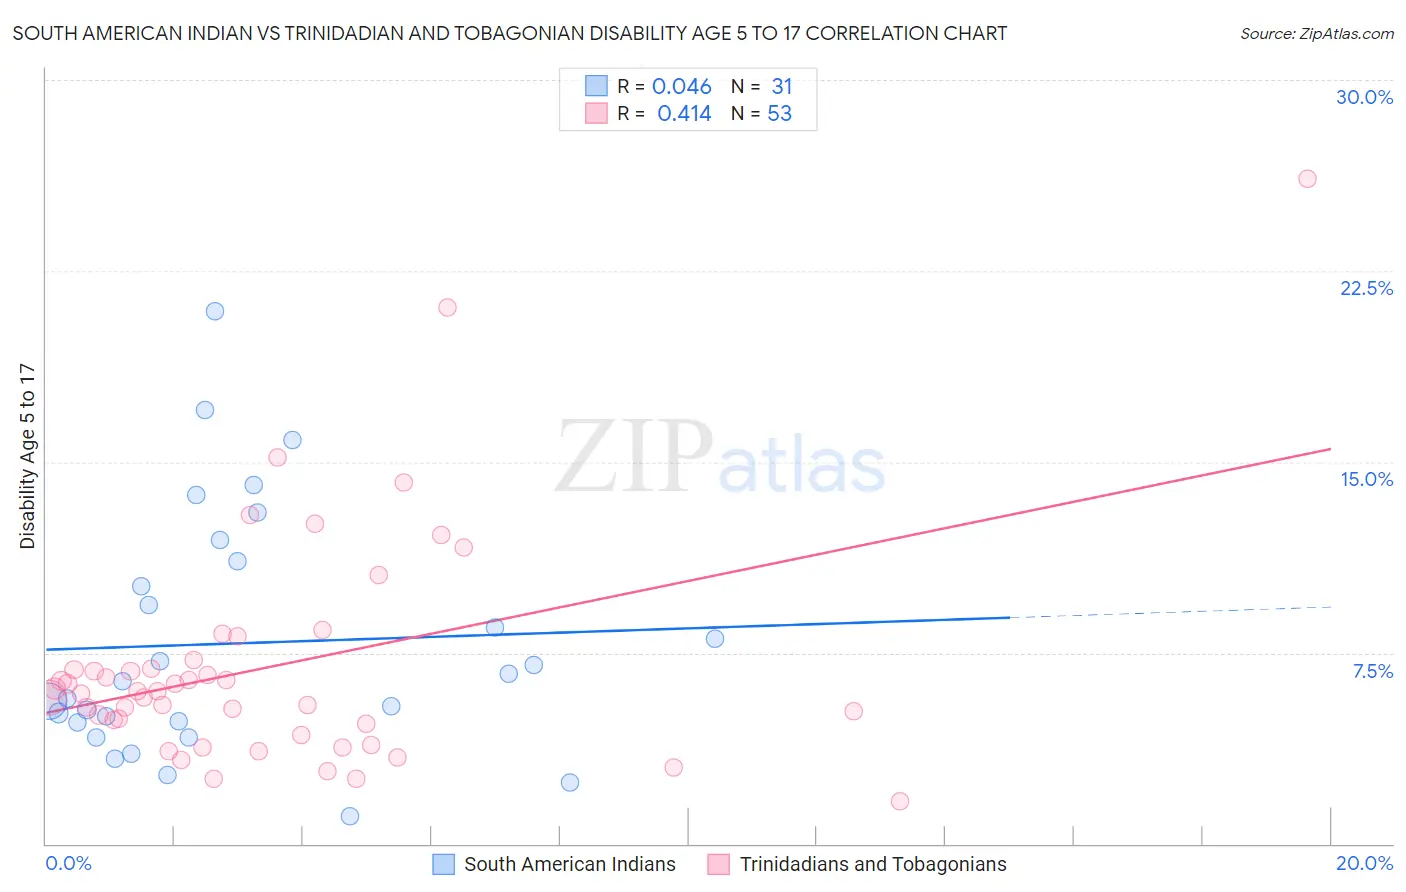
South American Indian vs Trinidadian and Tobagonian Disability Age 5 to 17 Correlation Chart
The statistical analysis conducted on geographies consisting of 164,285,003 people shows no correlation between the proportion of South American Indians and percentage of population with a disability between the ages 5 and 17 in the United States with a correlation coefficient (R) of 0.046 and weighted average of 5.5%. Similarly, the statistical analysis conducted on geographies consisting of 219,004,260 people shows a moderate positive correlation between the proportion of Trinidadians and Tobagonians and percentage of population with a disability between the ages 5 and 17 in the United States with a correlation coefficient (R) of 0.414 and weighted average of 5.7%, a difference of 5.4%.
Disability Age 5 to 17 Correlation Summary
| Measurement | South American Indian | Trinidadian and Tobagonian |
| Minimum | 1.1% | 1.7% |
| Maximum | 20.9% | 26.1% |
| Range | 19.8% | 24.4% |
| Mean | 7.9% | 7.0% |
| Median | 6.4% | 6.0% |
| Interquartile 25% (IQ1) | 4.8% | 4.5% |
| Interquartile 75% (IQ3) | 11.1% | 7.0% |
| Interquartile Range (IQR) | 6.3% | 2.5% |
| Standard Deviation (Sample) | 4.8% | 4.5% |
| Standard Deviation (Population) | 4.7% | 4.4% |
Similar Demographics by Disability Age 5 to 17
Demographics Similar to South American Indians by Disability Age 5 to 17
In terms of disability age 5 to 17, the demographic groups most similar to South American Indians are Colombian (5.5%, a difference of 0.15%), Immigrants from Netherlands (5.4%, a difference of 0.17%), Immigrants from Hungary (5.5%, a difference of 0.17%), Immigrants from Oceania (5.4%, a difference of 0.22%), and Belizean (5.4%, a difference of 0.22%).
| Demographics | Rating | Rank | Disability Age 5 to 17 |
| Yuman | 92.3 /100 | #134 | Exceptional 5.4% |
| Immigrants | Belize | 91.7 /100 | #135 | Exceptional 5.4% |
| Immigrants | Denmark | 91.4 /100 | #136 | Exceptional 5.4% |
| Navajo | 90.9 /100 | #137 | Exceptional 5.4% |
| Immigrants | Oceania | 90.8 /100 | #138 | Exceptional 5.4% |
| Belizeans | 90.8 /100 | #139 | Exceptional 5.4% |
| Immigrants | Netherlands | 90.5 /100 | #140 | Exceptional 5.4% |
| South American Indians | 89.3 /100 | #141 | Excellent 5.5% |
| Colombians | 88.0 /100 | #142 | Excellent 5.5% |
| Immigrants | Hungary | 87.9 /100 | #143 | Excellent 5.5% |
| Pakistanis | 87.3 /100 | #144 | Excellent 5.5% |
| Immigrants | Guatemala | 86.6 /100 | #145 | Excellent 5.5% |
| Albanians | 83.7 /100 | #146 | Excellent 5.5% |
| Immigrants | Albania | 83.1 /100 | #147 | Excellent 5.5% |
| Samoans | 81.9 /100 | #148 | Excellent 5.5% |
Demographics Similar to Trinidadians and Tobagonians by Disability Age 5 to 17
In terms of disability age 5 to 17, the demographic groups most similar to Trinidadians and Tobagonians are Immigrants from Africa (5.7%, a difference of 0.0%), Paiute (5.7%, a difference of 0.050%), Moroccan (5.7%, a difference of 0.050%), Kenyan (5.8%, a difference of 0.10%), and Immigrants from Uganda (5.8%, a difference of 0.14%).
| Demographics | Rating | Rank | Disability Age 5 to 17 |
| Norwegians | 20.9 /100 | #198 | Fair 5.7% |
| Northern Europeans | 15.2 /100 | #199 | Poor 5.7% |
| Icelanders | 14.6 /100 | #200 | Poor 5.7% |
| Basques | 13.7 /100 | #201 | Poor 5.7% |
| Austrians | 13.2 /100 | #202 | Poor 5.7% |
| Spanish American Indians | 12.8 /100 | #203 | Poor 5.7% |
| Paiute | 11.2 /100 | #204 | Poor 5.7% |
| Trinidadians and Tobagonians | 10.8 /100 | #205 | Poor 5.7% |
| Immigrants | Africa | 10.8 /100 | #206 | Poor 5.7% |
| Moroccans | 10.4 /100 | #207 | Poor 5.7% |
| Kenyans | 10.0 /100 | #208 | Poor 5.8% |
| Immigrants | Uganda | 9.7 /100 | #209 | Tragic 5.8% |
| Immigrants | Haiti | 9.5 /100 | #210 | Tragic 5.8% |
| Yugoslavians | 9.1 /100 | #211 | Tragic 5.8% |
| Immigrants | Panama | 8.7 /100 | #212 | Tragic 5.8% |