Bolivian vs Immigrants from Northern Europe In Labor Force | Age 16-19
COMPARE
Bolivian
Immigrants from Northern Europe
In Labor Force | Age 16-19
In Labor Force | Age 16-19 Comparison
Bolivians
Immigrants from Northern Europe
36.0%
IN LABOR FORCE | AGE 16-19
23.3/ 100
METRIC RATING
195th/ 347
METRIC RANK
36.5%
IN LABOR FORCE | AGE 16-19
46.6/ 100
METRIC RATING
177th/ 347
METRIC RANK
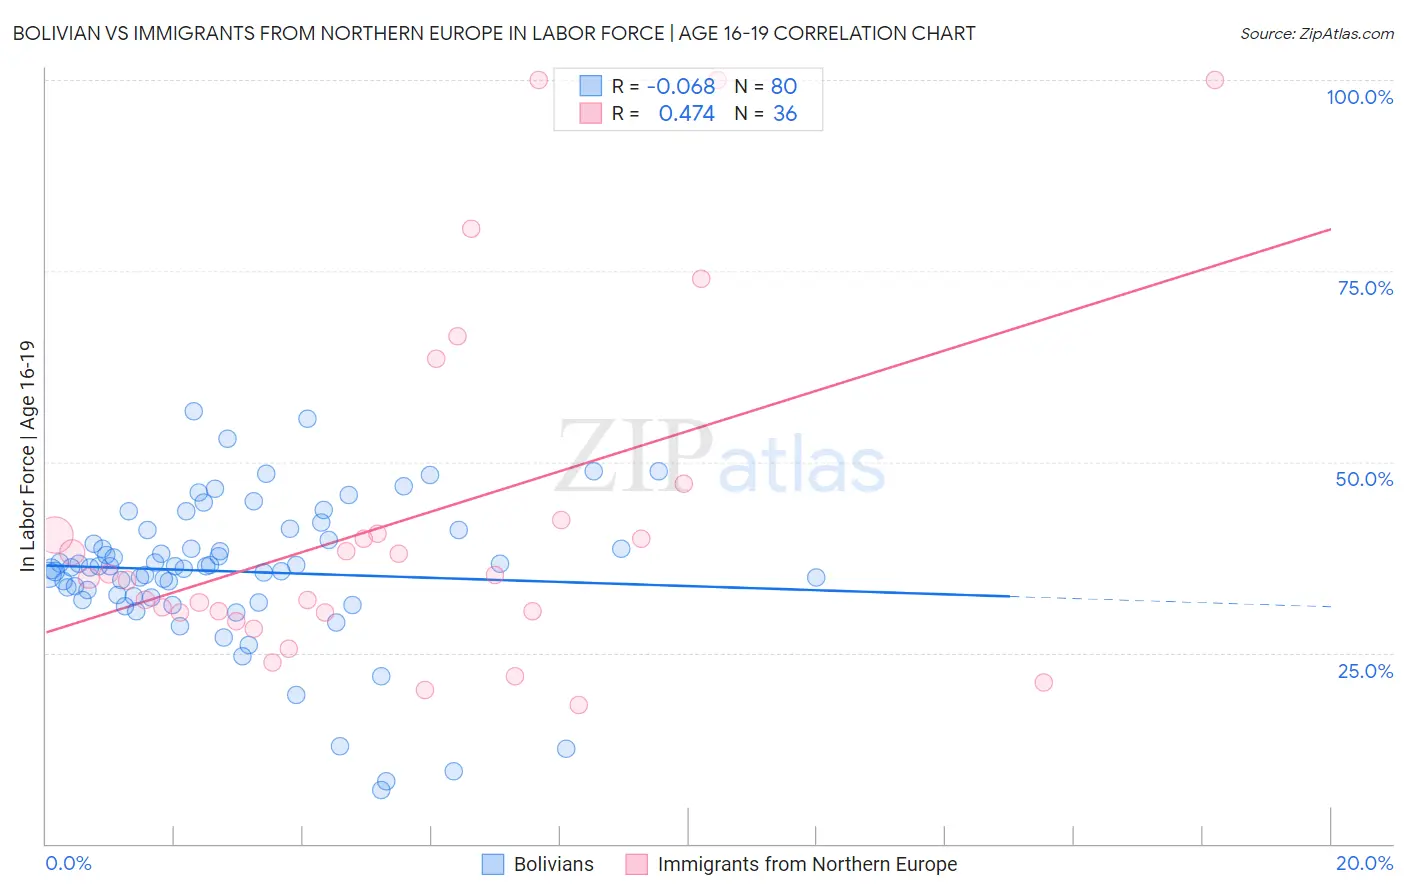
Bolivian vs Immigrants from Northern Europe In Labor Force | Age 16-19 Correlation Chart
The statistical analysis conducted on geographies consisting of 184,559,639 people shows a slight negative correlation between the proportion of Bolivians and labor force participation rate among population between the ages 16 and 19 in the United States with a correlation coefficient (R) of -0.068 and weighted average of 36.0%. Similarly, the statistical analysis conducted on geographies consisting of 475,712,736 people shows a moderate positive correlation between the proportion of Immigrants from Northern Europe and labor force participation rate among population between the ages 16 and 19 in the United States with a correlation coefficient (R) of 0.474 and weighted average of 36.5%, a difference of 1.3%.
In Labor Force | Age 16-19 Correlation Summary
| Measurement | Bolivian | Immigrants from Northern Europe |
| Minimum | 7.1% | 18.2% |
| Maximum | 56.7% | 100.0% |
| Range | 49.6% | 81.8% |
| Mean | 35.6% | 42.4% |
| Median | 36.3% | 35.0% |
| Interquartile 25% (IQ1) | 32.3% | 30.3% |
| Interquartile 75% (IQ3) | 40.4% | 41.5% |
| Interquartile Range (IQR) | 8.1% | 11.2% |
| Standard Deviation (Sample) | 9.5% | 22.5% |
| Standard Deviation (Population) | 9.5% | 22.2% |
Demographics Similar to Bolivians and Immigrants from Northern Europe by In Labor Force | Age 16-19
In terms of in labor force | age 16-19, the demographic groups most similar to Bolivians are Nigerian (36.1%, a difference of 0.090%), Immigrants from Denmark (36.1%, a difference of 0.12%), Afghan (36.1%, a difference of 0.16%), Mexican American Indian (36.0%, a difference of 0.16%), and Immigrants from Croatia (36.1%, a difference of 0.29%). Similarly, the demographic groups most similar to Immigrants from Northern Europe are Black/African American (36.5%, a difference of 0.080%), Albanian (36.5%, a difference of 0.11%), Immigrants from Southern Europe (36.4%, a difference of 0.17%), Immigrants from Morocco (36.4%, a difference of 0.28%), and Jordanian (36.4%, a difference of 0.36%).
| Demographics | Rating | Rank | In Labor Force | Age 16-19 |
| Albanians | 48.8 /100 | #176 | Average 36.5% |
| Immigrants | Northern Europe | 46.6 /100 | #177 | Average 36.5% |
| Blacks/African Americans | 45.1 /100 | #178 | Average 36.5% |
| Immigrants | Southern Europe | 43.3 /100 | #179 | Average 36.4% |
| Immigrants | Morocco | 41.1 /100 | #180 | Average 36.4% |
| Jordanians | 39.6 /100 | #181 | Fair 36.4% |
| Immigrants | Italy | 39.1 /100 | #182 | Fair 36.4% |
| Eastern Europeans | 38.8 /100 | #183 | Fair 36.4% |
| Costa Ricans | 36.1 /100 | #184 | Fair 36.3% |
| Bhutanese | 35.3 /100 | #185 | Fair 36.3% |
| Immigrants | Romania | 34.0 /100 | #186 | Fair 36.3% |
| Immigrants | Afghanistan | 34.0 /100 | #187 | Fair 36.3% |
| Immigrants | Europe | 31.8 /100 | #188 | Fair 36.2% |
| Immigrants | Hungary | 28.8 /100 | #189 | Fair 36.2% |
| Panamanians | 28.6 /100 | #190 | Fair 36.1% |
| Immigrants | Croatia | 27.5 /100 | #191 | Fair 36.1% |
| Afghans | 25.7 /100 | #192 | Fair 36.1% |
| Immigrants | Denmark | 25.0 /100 | #193 | Fair 36.1% |
| Nigerians | 24.6 /100 | #194 | Fair 36.1% |
| Bolivians | 23.3 /100 | #195 | Fair 36.0% |
| Mexican American Indians | 21.1 /100 | #196 | Fair 36.0% |