Black/African American vs Puget Sound Salish Disability Age 65 to 74
COMPARE
Black/African American
Puget Sound Salish
Disability Age 65 to 74
Disability Age 65 to 74 Comparison
Blacks/African Americans
Puget Sound Salish
27.3%
DISABILITY AGE 65 TO 74
0.0/ 100
METRIC RATING
306th/ 347
METRIC RANK
27.2%
DISABILITY AGE 65 TO 74
0.0/ 100
METRIC RATING
304th/ 347
METRIC RANK
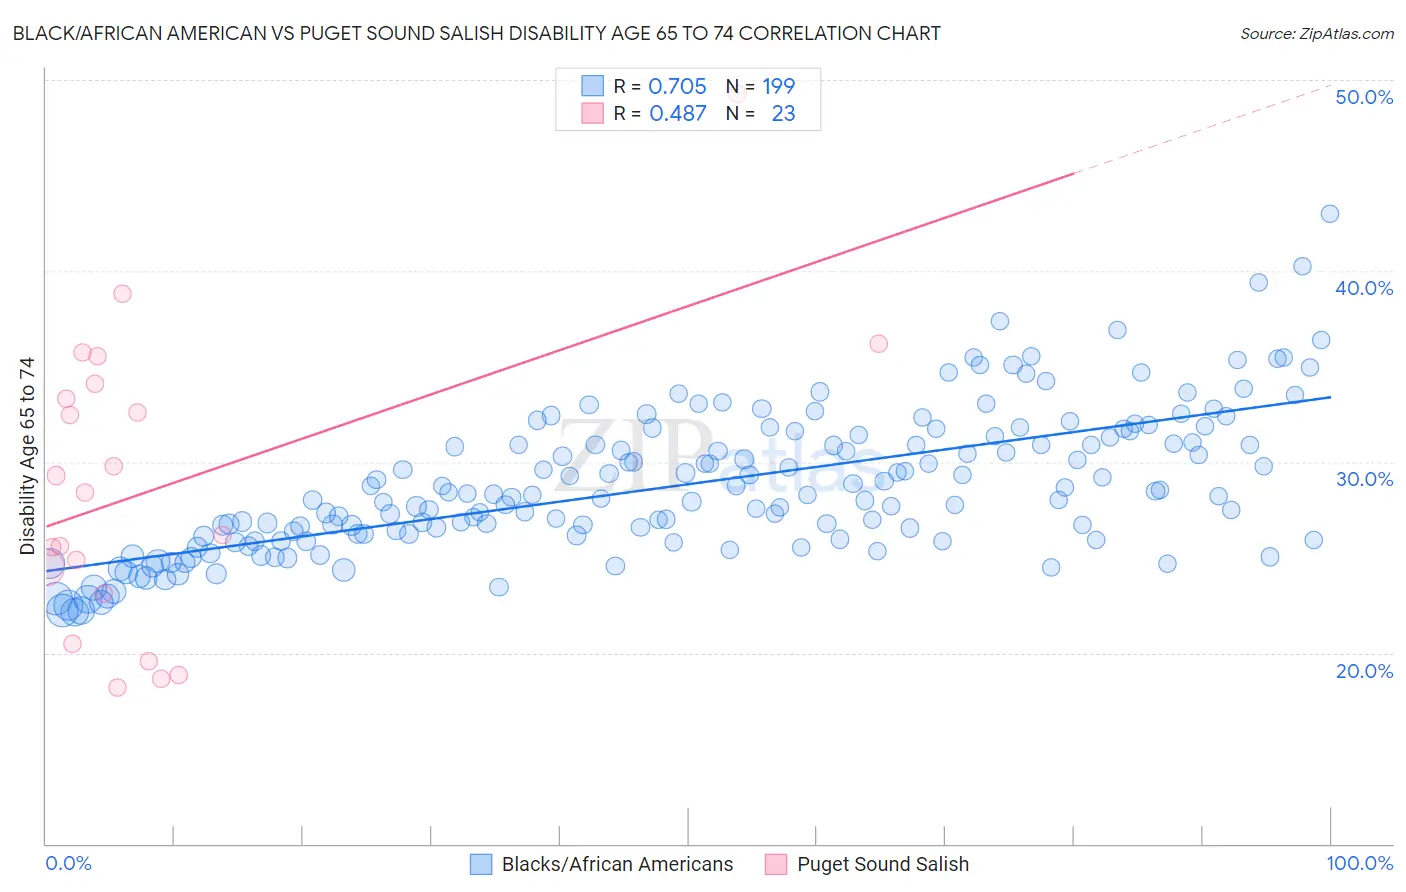
Black/African American vs Puget Sound Salish Disability Age 65 to 74 Correlation Chart
The statistical analysis conducted on geographies consisting of 563,649,388 people shows a strong positive correlation between the proportion of Blacks/African Americans and percentage of population with a disability between the ages 65 and 75 in the United States with a correlation coefficient (R) of 0.705 and weighted average of 27.3%. Similarly, the statistical analysis conducted on geographies consisting of 46,105,996 people shows a moderate positive correlation between the proportion of Puget Sound Salish and percentage of population with a disability between the ages 65 and 75 in the United States with a correlation coefficient (R) of 0.487 and weighted average of 27.2%, a difference of 0.50%.
Disability Age 65 to 74 Correlation Summary
| Measurement | Black/African American | Puget Sound Salish |
| Minimum | 22.1% | 18.2% |
| Maximum | 43.0% | 49.3% |
| Range | 20.9% | 31.1% |
| Mean | 28.8% | 28.7% |
| Median | 28.2% | 28.4% |
| Interquartile 25% (IQ1) | 26.1% | 23.1% |
| Interquartile 75% (IQ3) | 31.3% | 34.1% |
| Interquartile Range (IQR) | 5.2% | 11.0% |
| Standard Deviation (Sample) | 3.7% | 7.7% |
| Standard Deviation (Population) | 3.7% | 7.5% |
Demographics Similar to Blacks/African Americans and Puget Sound Salish by Disability Age 65 to 74
In terms of disability age 65 to 74, the demographic groups most similar to Blacks/African Americans are Ute (27.3%, a difference of 0.060%), Sioux (27.3%, a difference of 0.21%), Yaqui (27.4%, a difference of 0.27%), Shoshone (27.4%, a difference of 0.32%), and Mexican (27.2%, a difference of 0.40%). Similarly, the demographic groups most similar to Puget Sound Salish are Mexican (27.2%, a difference of 0.10%), Tlingit-Haida (27.1%, a difference of 0.12%), Central American Indian (27.1%, a difference of 0.18%), Immigrants from Mexico (27.1%, a difference of 0.19%), and Immigrants from Dominican Republic (27.0%, a difference of 0.51%).
| Demographics | Rating | Rank | Disability Age 65 to 74 |
| Hispanics or Latinos | 0.0 /100 | #295 | Tragic 26.7% |
| Bangladeshis | 0.0 /100 | #296 | Tragic 26.8% |
| Fijians | 0.0 /100 | #297 | Tragic 27.0% |
| Immigrants | Yemen | 0.0 /100 | #298 | Tragic 27.0% |
| Potawatomi | 0.0 /100 | #299 | Tragic 27.0% |
| Immigrants | Dominican Republic | 0.0 /100 | #300 | Tragic 27.0% |
| Immigrants | Mexico | 0.0 /100 | #301 | Tragic 27.1% |
| Central American Indians | 0.0 /100 | #302 | Tragic 27.1% |
| Tlingit-Haida | 0.0 /100 | #303 | Tragic 27.1% |
| Puget Sound Salish | 0.0 /100 | #304 | Tragic 27.2% |
| Mexicans | 0.0 /100 | #305 | Tragic 27.2% |
| Blacks/African Americans | 0.0 /100 | #306 | Tragic 27.3% |
| Ute | 0.0 /100 | #307 | Tragic 27.3% |
| Sioux | 0.0 /100 | #308 | Tragic 27.3% |
| Yaqui | 0.0 /100 | #309 | Tragic 27.4% |
| Shoshone | 0.0 /100 | #310 | Tragic 27.4% |
| Menominee | 0.0 /100 | #311 | Tragic 27.4% |
| Osage | 0.0 /100 | #312 | Tragic 27.5% |
| Paiute | 0.0 /100 | #313 | Tragic 27.8% |
| Chippewa | 0.0 /100 | #314 | Tragic 27.8% |
| Cajuns | 0.0 /100 | #315 | Tragic 27.9% |