Black/African American vs Slavic Disability Age 65 to 74
COMPARE
Black/African American
Slavic
Disability Age 65 to 74
Disability Age 65 to 74 Comparison
Blacks/African Americans
Slavs
27.3%
DISABILITY AGE 65 TO 74
0.0/ 100
METRIC RATING
306th/ 347
METRIC RANK
23.0%
DISABILITY AGE 65 TO 74
75.2/ 100
METRIC RATING
153rd/ 347
METRIC RANK
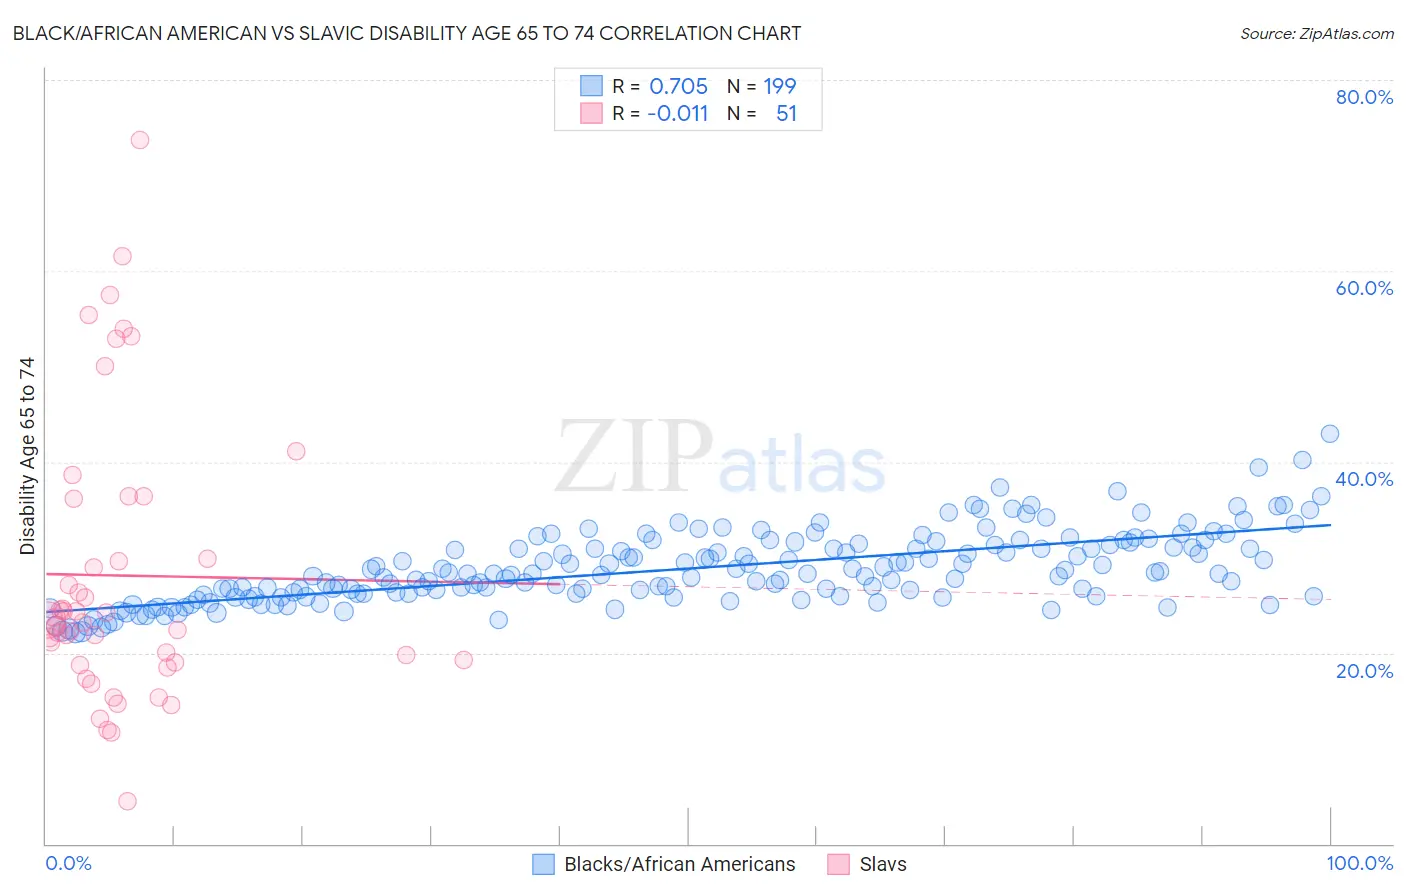
Black/African American vs Slavic Disability Age 65 to 74 Correlation Chart
The statistical analysis conducted on geographies consisting of 563,649,388 people shows a strong positive correlation between the proportion of Blacks/African Americans and percentage of population with a disability between the ages 65 and 75 in the United States with a correlation coefficient (R) of 0.705 and weighted average of 27.3%. Similarly, the statistical analysis conducted on geographies consisting of 270,690,896 people shows no correlation between the proportion of Slavs and percentage of population with a disability between the ages 65 and 75 in the United States with a correlation coefficient (R) of -0.011 and weighted average of 23.0%, a difference of 18.9%.
Disability Age 65 to 74 Correlation Summary
| Measurement | Black/African American | Slavic |
| Minimum | 22.1% | 4.4% |
| Maximum | 43.0% | 73.7% |
| Range | 20.9% | 69.2% |
| Mean | 28.8% | 28.1% |
| Median | 28.2% | 23.4% |
| Interquartile 25% (IQ1) | 26.1% | 19.0% |
| Interquartile 75% (IQ3) | 31.3% | 36.1% |
| Interquartile Range (IQR) | 5.2% | 17.1% |
| Standard Deviation (Sample) | 3.7% | 14.7% |
| Standard Deviation (Population) | 3.7% | 14.6% |
Similar Demographics by Disability Age 65 to 74
Demographics Similar to Blacks/African Americans by Disability Age 65 to 74
In terms of disability age 65 to 74, the demographic groups most similar to Blacks/African Americans are Ute (27.3%, a difference of 0.060%), Sioux (27.3%, a difference of 0.21%), Yaqui (27.4%, a difference of 0.27%), Shoshone (27.4%, a difference of 0.32%), and Mexican (27.2%, a difference of 0.40%).
| Demographics | Rating | Rank | Disability Age 65 to 74 |
| Potawatomi | 0.0 /100 | #299 | Tragic 27.0% |
| Immigrants | Dominican Republic | 0.0 /100 | #300 | Tragic 27.0% |
| Immigrants | Mexico | 0.0 /100 | #301 | Tragic 27.1% |
| Central American Indians | 0.0 /100 | #302 | Tragic 27.1% |
| Tlingit-Haida | 0.0 /100 | #303 | Tragic 27.1% |
| Puget Sound Salish | 0.0 /100 | #304 | Tragic 27.2% |
| Mexicans | 0.0 /100 | #305 | Tragic 27.2% |
| Blacks/African Americans | 0.0 /100 | #306 | Tragic 27.3% |
| Ute | 0.0 /100 | #307 | Tragic 27.3% |
| Sioux | 0.0 /100 | #308 | Tragic 27.3% |
| Yaqui | 0.0 /100 | #309 | Tragic 27.4% |
| Shoshone | 0.0 /100 | #310 | Tragic 27.4% |
| Menominee | 0.0 /100 | #311 | Tragic 27.4% |
| Osage | 0.0 /100 | #312 | Tragic 27.5% |
| Paiute | 0.0 /100 | #313 | Tragic 27.8% |
Demographics Similar to Slavs by Disability Age 65 to 74
In terms of disability age 65 to 74, the demographic groups most similar to Slavs are Sri Lankan (23.0%, a difference of 0.090%), British (23.0%, a difference of 0.10%), Immigrants from Western Asia (23.0%, a difference of 0.10%), Finnish (22.9%, a difference of 0.11%), and Canadian (22.9%, a difference of 0.20%).
| Demographics | Rating | Rank | Disability Age 65 to 74 |
| Alsatians | 83.7 /100 | #146 | Excellent 22.8% |
| Immigrants | Uzbekistan | 83.1 /100 | #147 | Excellent 22.8% |
| New Zealanders | 79.9 /100 | #148 | Good 22.9% |
| Swiss | 79.7 /100 | #149 | Good 22.9% |
| Canadians | 77.7 /100 | #150 | Good 22.9% |
| Immigrants | Morocco | 77.6 /100 | #151 | Good 22.9% |
| Finns | 76.5 /100 | #152 | Good 22.9% |
| Slavs | 75.2 /100 | #153 | Good 23.0% |
| Sri Lankans | 74.0 /100 | #154 | Good 23.0% |
| British | 73.9 /100 | #155 | Good 23.0% |
| Immigrants | Western Asia | 73.8 /100 | #156 | Good 23.0% |
| Czechoslovakians | 72.4 /100 | #157 | Good 23.0% |
| Immigrants | Vietnam | 69.1 /100 | #158 | Good 23.1% |
| South American Indians | 65.5 /100 | #159 | Good 23.1% |
| Koreans | 64.2 /100 | #160 | Good 23.1% |