Tongan vs Puget Sound Salish Disability Age 65 to 74
COMPARE
Tongan
Puget Sound Salish
Disability Age 65 to 74
Disability Age 65 to 74 Comparison
Tongans
Puget Sound Salish
23.8%
DISABILITY AGE 65 TO 74
20.8/ 100
METRIC RATING
205th/ 347
METRIC RANK
27.2%
DISABILITY AGE 65 TO 74
0.0/ 100
METRIC RATING
304th/ 347
METRIC RANK
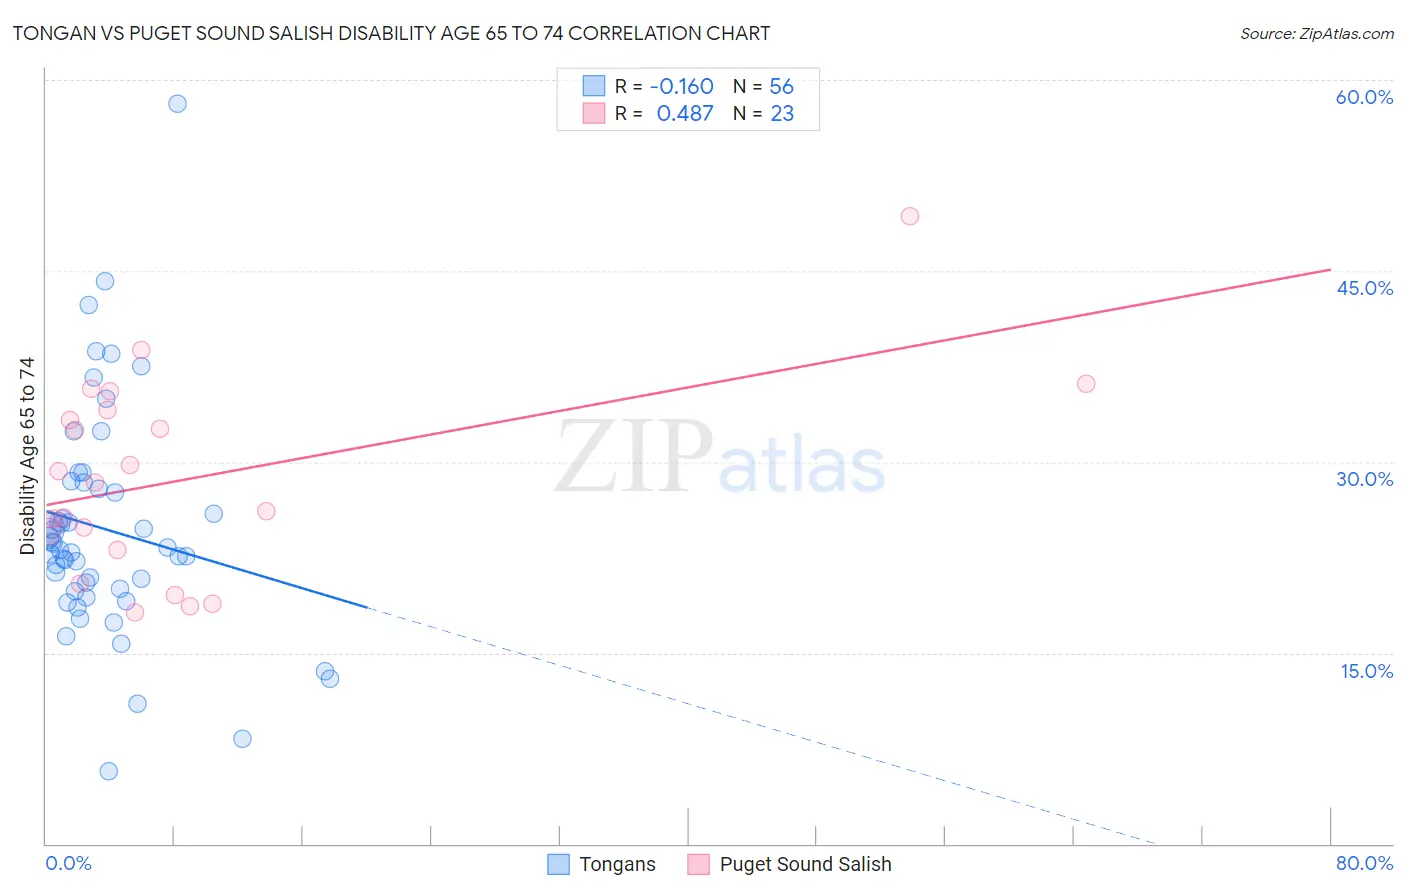
Tongan vs Puget Sound Salish Disability Age 65 to 74 Correlation Chart
The statistical analysis conducted on geographies consisting of 102,809,825 people shows a poor negative correlation between the proportion of Tongans and percentage of population with a disability between the ages 65 and 75 in the United States with a correlation coefficient (R) of -0.160 and weighted average of 23.8%. Similarly, the statistical analysis conducted on geographies consisting of 46,105,996 people shows a moderate positive correlation between the proportion of Puget Sound Salish and percentage of population with a disability between the ages 65 and 75 in the United States with a correlation coefficient (R) of 0.487 and weighted average of 27.2%, a difference of 14.1%.
Disability Age 65 to 74 Correlation Summary
| Measurement | Tongan | Puget Sound Salish |
| Minimum | 5.7% | 18.2% |
| Maximum | 58.2% | 49.3% |
| Range | 52.5% | 31.1% |
| Mean | 24.7% | 28.7% |
| Median | 23.2% | 28.4% |
| Interquartile 25% (IQ1) | 20.0% | 23.1% |
| Interquartile 75% (IQ3) | 28.1% | 34.1% |
| Interquartile Range (IQR) | 8.2% | 11.0% |
| Standard Deviation (Sample) | 9.0% | 7.7% |
| Standard Deviation (Population) | 8.9% | 7.5% |
Similar Demographics by Disability Age 65 to 74
Demographics Similar to Tongans by Disability Age 65 to 74
In terms of disability age 65 to 74, the demographic groups most similar to Tongans are Immigrants from Jamaica (23.8%, a difference of 0.0%), Immigrants from Sudan (23.8%, a difference of 0.060%), Immigrants from Barbados (23.8%, a difference of 0.10%), Immigrants from Grenada (23.8%, a difference of 0.11%), and Immigrants from Kenya (23.8%, a difference of 0.11%).
| Demographics | Rating | Rank | Disability Age 65 to 74 |
| Immigrants | Africa | 24.4 /100 | #198 | Fair 23.7% |
| Welsh | 24.3 /100 | #199 | Fair 23.7% |
| French Canadians | 24.0 /100 | #200 | Fair 23.7% |
| Immigrants | Ecuador | 23.9 /100 | #201 | Fair 23.7% |
| Immigrants | Bahamas | 23.3 /100 | #202 | Fair 23.7% |
| Kenyans | 23.2 /100 | #203 | Fair 23.7% |
| Immigrants | Grenada | 22.1 /100 | #204 | Fair 23.8% |
| Tongans | 20.8 /100 | #205 | Fair 23.8% |
| Immigrants | Jamaica | 20.7 /100 | #206 | Fair 23.8% |
| Immigrants | Sudan | 20.1 /100 | #207 | Fair 23.8% |
| Immigrants | Barbados | 19.6 /100 | #208 | Poor 23.8% |
| Immigrants | Kenya | 19.6 /100 | #209 | Poor 23.8% |
| Trinidadians and Tobagonians | 16.4 /100 | #210 | Poor 23.9% |
| Immigrants | West Indies | 15.9 /100 | #211 | Poor 23.9% |
| French | 15.7 /100 | #212 | Poor 23.9% |
Demographics Similar to Puget Sound Salish by Disability Age 65 to 74
In terms of disability age 65 to 74, the demographic groups most similar to Puget Sound Salish are Mexican (27.2%, a difference of 0.10%), Tlingit-Haida (27.1%, a difference of 0.12%), Central American Indian (27.1%, a difference of 0.18%), Immigrants from Mexico (27.1%, a difference of 0.19%), and Black/African American (27.3%, a difference of 0.50%).
| Demographics | Rating | Rank | Disability Age 65 to 74 |
| Fijians | 0.0 /100 | #297 | Tragic 27.0% |
| Immigrants | Yemen | 0.0 /100 | #298 | Tragic 27.0% |
| Potawatomi | 0.0 /100 | #299 | Tragic 27.0% |
| Immigrants | Dominican Republic | 0.0 /100 | #300 | Tragic 27.0% |
| Immigrants | Mexico | 0.0 /100 | #301 | Tragic 27.1% |
| Central American Indians | 0.0 /100 | #302 | Tragic 27.1% |
| Tlingit-Haida | 0.0 /100 | #303 | Tragic 27.1% |
| Puget Sound Salish | 0.0 /100 | #304 | Tragic 27.2% |
| Mexicans | 0.0 /100 | #305 | Tragic 27.2% |
| Blacks/African Americans | 0.0 /100 | #306 | Tragic 27.3% |
| Ute | 0.0 /100 | #307 | Tragic 27.3% |
| Sioux | 0.0 /100 | #308 | Tragic 27.3% |
| Yaqui | 0.0 /100 | #309 | Tragic 27.4% |
| Shoshone | 0.0 /100 | #310 | Tragic 27.4% |
| Menominee | 0.0 /100 | #311 | Tragic 27.4% |