Black/African American vs Puget Sound Salish Poverty
COMPARE
Black/African American
Puget Sound Salish
Poverty
Poverty Comparison
Blacks/African Americans
Puget Sound Salish
17.3%
POVERTY
0.0/ 100
METRIC RATING
329th/ 347
METRIC RANK
11.7%
POVERTY
88.7/ 100
METRIC RATING
122nd/ 347
METRIC RANK
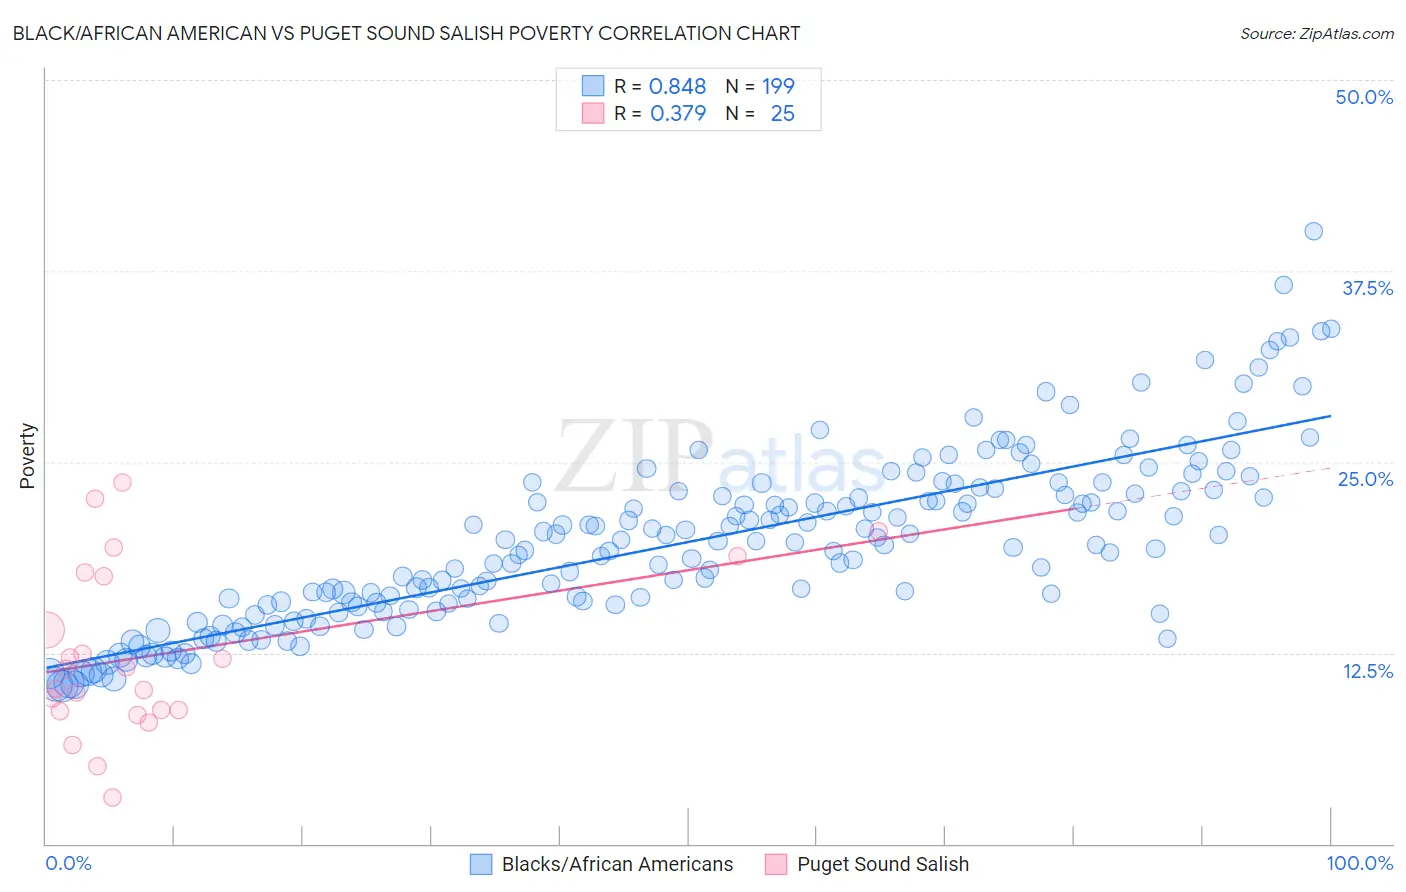
Black/African American vs Puget Sound Salish Poverty Correlation Chart
The statistical analysis conducted on geographies consisting of 565,229,178 people shows a very strong positive correlation between the proportion of Blacks/African Americans and poverty level in the United States with a correlation coefficient (R) of 0.848 and weighted average of 17.3%. Similarly, the statistical analysis conducted on geographies consisting of 46,150,573 people shows a mild positive correlation between the proportion of Puget Sound Salish and poverty level in the United States with a correlation coefficient (R) of 0.379 and weighted average of 11.7%, a difference of 47.4%.
Poverty Correlation Summary
| Measurement | Black/African American | Puget Sound Salish |
| Minimum | 10.3% | 3.0% |
| Maximum | 40.1% | 23.7% |
| Range | 29.8% | 20.7% |
| Mean | 19.7% | 12.4% |
| Median | 19.6% | 11.4% |
| Interquartile 25% (IQ1) | 15.7% | 8.7% |
| Interquartile 75% (IQ3) | 23.1% | 17.7% |
| Interquartile Range (IQR) | 7.4% | 9.0% |
| Standard Deviation (Sample) | 5.6% | 5.5% |
| Standard Deviation (Population) | 5.6% | 5.4% |
Similar Demographics by Poverty
Demographics Similar to Blacks/African Americans by Poverty
In terms of poverty, the demographic groups most similar to Blacks/African Americans are Ute (16.9%, a difference of 2.0%), Dominican (17.6%, a difference of 2.3%), Kiowa (16.8%, a difference of 2.5%), Paiute (16.7%, a difference of 3.0%), and Immigrants from Dominican Republic (17.8%, a difference of 3.2%).
| Demographics | Rating | Rank | Poverty |
| Menominee | 0.0 /100 | #322 | Tragic 16.4% |
| Colville | 0.0 /100 | #323 | Tragic 16.6% |
| Yakama | 0.0 /100 | #324 | Tragic 16.7% |
| Central American Indians | 0.0 /100 | #325 | Tragic 16.7% |
| Paiute | 0.0 /100 | #326 | Tragic 16.7% |
| Kiowa | 0.0 /100 | #327 | Tragic 16.8% |
| Ute | 0.0 /100 | #328 | Tragic 16.9% |
| Blacks/African Americans | 0.0 /100 | #329 | Tragic 17.3% |
| Dominicans | 0.0 /100 | #330 | Tragic 17.6% |
| Immigrants | Dominican Republic | 0.0 /100 | #331 | Tragic 17.8% |
| Natives/Alaskans | 0.0 /100 | #332 | Tragic 18.1% |
| Houma | 0.0 /100 | #333 | Tragic 18.4% |
| Apache | 0.0 /100 | #334 | Tragic 18.4% |
| Cheyenne | 0.0 /100 | #335 | Tragic 18.9% |
| Pueblo | 0.0 /100 | #336 | Tragic 19.4% |
Demographics Similar to Puget Sound Salish by Poverty
In terms of poverty, the demographic groups most similar to Puget Sound Salish are New Zealander (11.7%, a difference of 0.0%), Immigrants from Hungary (11.7%, a difference of 0.020%), Immigrants from South Eastern Asia (11.7%, a difference of 0.060%), Tlingit-Haida (11.7%, a difference of 0.070%), and Soviet Union (11.7%, a difference of 0.090%).
| Demographics | Rating | Rank | Poverty |
| Albanians | 90.3 /100 | #115 | Exceptional 11.7% |
| Immigrants | Russia | 89.7 /100 | #116 | Excellent 11.7% |
| Sri Lankans | 89.4 /100 | #117 | Excellent 11.7% |
| Argentineans | 89.1 /100 | #118 | Excellent 11.7% |
| Tlingit-Haida | 89.0 /100 | #119 | Excellent 11.7% |
| Immigrants | South Eastern Asia | 88.9 /100 | #120 | Excellent 11.7% |
| New Zealanders | 88.7 /100 | #121 | Excellent 11.7% |
| Puget Sound Salish | 88.7 /100 | #122 | Excellent 11.7% |
| Immigrants | Hungary | 88.6 /100 | #123 | Excellent 11.7% |
| Soviet Union | 88.4 /100 | #124 | Excellent 11.7% |
| Immigrants | Brazil | 88.2 /100 | #125 | Excellent 11.7% |
| Immigrants | Norway | 88.0 /100 | #126 | Excellent 11.7% |
| Immigrants | Argentina | 88.0 /100 | #127 | Excellent 11.7% |
| Immigrants | Israel | 87.4 /100 | #128 | Excellent 11.7% |
| South Africans | 87.0 /100 | #129 | Excellent 11.7% |