Black/African American vs Puget Sound Salish Vision Disability
COMPARE
Black/African American
Puget Sound Salish
Vision Disability
Vision Disability Comparison
Blacks/African Americans
Puget Sound Salish
2.8%
VISION DISABILITY
0.0/ 100
METRIC RATING
320th/ 347
METRIC RANK
2.5%
VISION DISABILITY
0.0/ 100
METRIC RATING
283rd/ 347
METRIC RANK
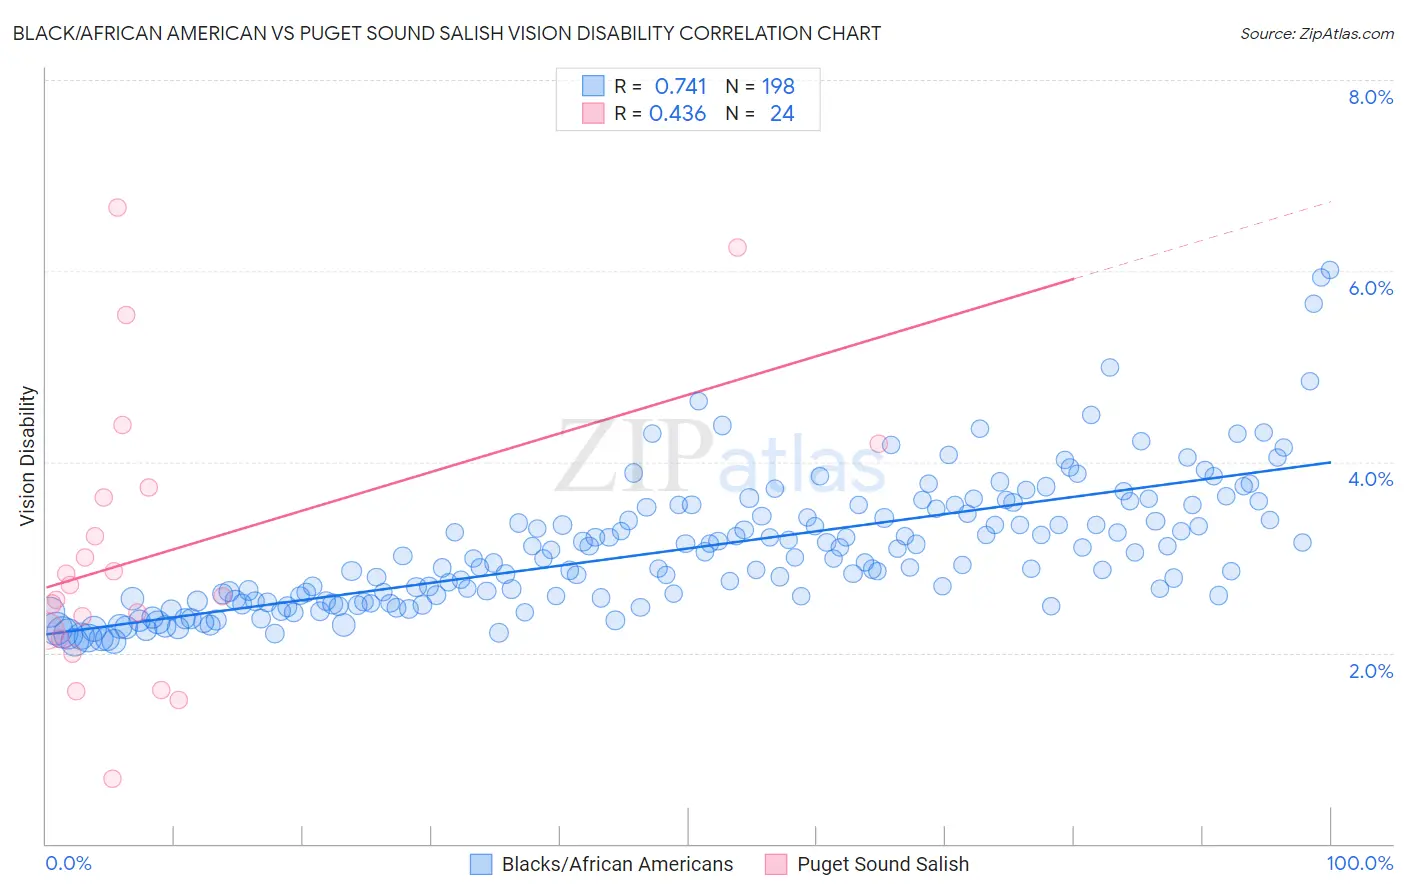
Black/African American vs Puget Sound Salish Vision Disability Correlation Chart
The statistical analysis conducted on geographies consisting of 564,452,359 people shows a strong positive correlation between the proportion of Blacks/African Americans and percentage of population with vision disability in the United States with a correlation coefficient (R) of 0.741 and weighted average of 2.8%. Similarly, the statistical analysis conducted on geographies consisting of 46,150,765 people shows a moderate positive correlation between the proportion of Puget Sound Salish and percentage of population with vision disability in the United States with a correlation coefficient (R) of 0.436 and weighted average of 2.5%, a difference of 13.4%.
Vision Disability Correlation Summary
| Measurement | Black/African American | Puget Sound Salish |
| Minimum | 2.1% | 0.69% |
| Maximum | 6.0% | 6.7% |
| Range | 3.9% | 6.0% |
| Mean | 3.1% | 3.1% |
| Median | 3.0% | 2.6% |
| Interquartile 25% (IQ1) | 2.5% | 2.2% |
| Interquartile 75% (IQ3) | 3.5% | 3.7% |
| Interquartile Range (IQR) | 0.91% | 1.5% |
| Standard Deviation (Sample) | 0.70% | 1.5% |
| Standard Deviation (Population) | 0.70% | 1.4% |
Similar Demographics by Vision Disability
Demographics Similar to Blacks/African Americans by Vision Disability
In terms of vision disability, the demographic groups most similar to Blacks/African Americans are Tohono O'odham (2.8%, a difference of 0.69%), Comanche (2.8%, a difference of 2.0%), Alaska Native (2.7%, a difference of 2.1%), Paiute (2.9%, a difference of 2.5%), and Tlingit-Haida (2.9%, a difference of 2.5%).
| Demographics | Rating | Rank | Vision Disability |
| Potawatomi | 0.0 /100 | #313 | Tragic 2.6% |
| Inupiat | 0.0 /100 | #314 | Tragic 2.7% |
| Osage | 0.0 /100 | #315 | Tragic 2.7% |
| Shoshone | 0.0 /100 | #316 | Tragic 2.7% |
| Yup'ik | 0.0 /100 | #317 | Tragic 2.7% |
| Alaska Natives | 0.0 /100 | #318 | Tragic 2.7% |
| Tohono O'odham | 0.0 /100 | #319 | Tragic 2.8% |
| Blacks/African Americans | 0.0 /100 | #320 | Tragic 2.8% |
| Comanche | 0.0 /100 | #321 | Tragic 2.8% |
| Paiute | 0.0 /100 | #322 | Tragic 2.9% |
| Tlingit-Haida | 0.0 /100 | #323 | Tragic 2.9% |
| Hopi | 0.0 /100 | #324 | Tragic 2.9% |
| Cherokee | 0.0 /100 | #325 | Tragic 2.9% |
| Spanish Americans | 0.0 /100 | #326 | Tragic 2.9% |
| Natives/Alaskans | 0.0 /100 | #327 | Tragic 3.0% |
Demographics Similar to Puget Sound Salish by Vision Disability
In terms of vision disability, the demographic groups most similar to Puget Sound Salish are Immigrants from Caribbean (2.5%, a difference of 0.13%), U.S. Virgin Islander (2.5%, a difference of 0.25%), Yakama (2.5%, a difference of 0.28%), Immigrants from Central America (2.5%, a difference of 0.30%), and Sioux (2.5%, a difference of 0.31%).
| Demographics | Rating | Rank | Vision Disability |
| Scotch-Irish | 0.0 /100 | #276 | Tragic 2.4% |
| Bahamians | 0.0 /100 | #277 | Tragic 2.4% |
| Spanish | 0.0 /100 | #278 | Tragic 2.4% |
| Nepalese | 0.0 /100 | #279 | Tragic 2.4% |
| Cape Verdeans | 0.0 /100 | #280 | Tragic 2.4% |
| U.S. Virgin Islanders | 0.0 /100 | #281 | Tragic 2.5% |
| Immigrants | Caribbean | 0.0 /100 | #282 | Tragic 2.5% |
| Puget Sound Salish | 0.0 /100 | #283 | Tragic 2.5% |
| Yakama | 0.0 /100 | #284 | Tragic 2.5% |
| Immigrants | Central America | 0.0 /100 | #285 | Tragic 2.5% |
| Sioux | 0.0 /100 | #286 | Tragic 2.5% |
| Hondurans | 0.0 /100 | #287 | Tragic 2.5% |
| French American Indians | 0.0 /100 | #288 | Tragic 2.5% |
| Immigrants | Nonimmigrants | 0.0 /100 | #289 | Tragic 2.5% |
| Immigrants | Cuba | 0.0 /100 | #290 | Tragic 2.5% |