Black/African American vs Puget Sound Salish Unemployment Among Women with Children Under 18 years
COMPARE
Black/African American
Puget Sound Salish
Unemployment Among Women with Children Under 18 years
Unemployment Among Women with Children Under 18 years Comparison
Blacks/African Americans
Puget Sound Salish
7.3%
UNEMPLOYMENT AMONG WOMEN WITH CHILDREN UNDER 18 YEARS
0.0/ 100
METRIC RATING
329th/ 347
METRIC RANK
5.1%
UNEMPLOYMENT AMONG WOMEN WITH CHILDREN UNDER 18 YEARS
95.8/ 100
METRIC RATING
76th/ 347
METRIC RANK
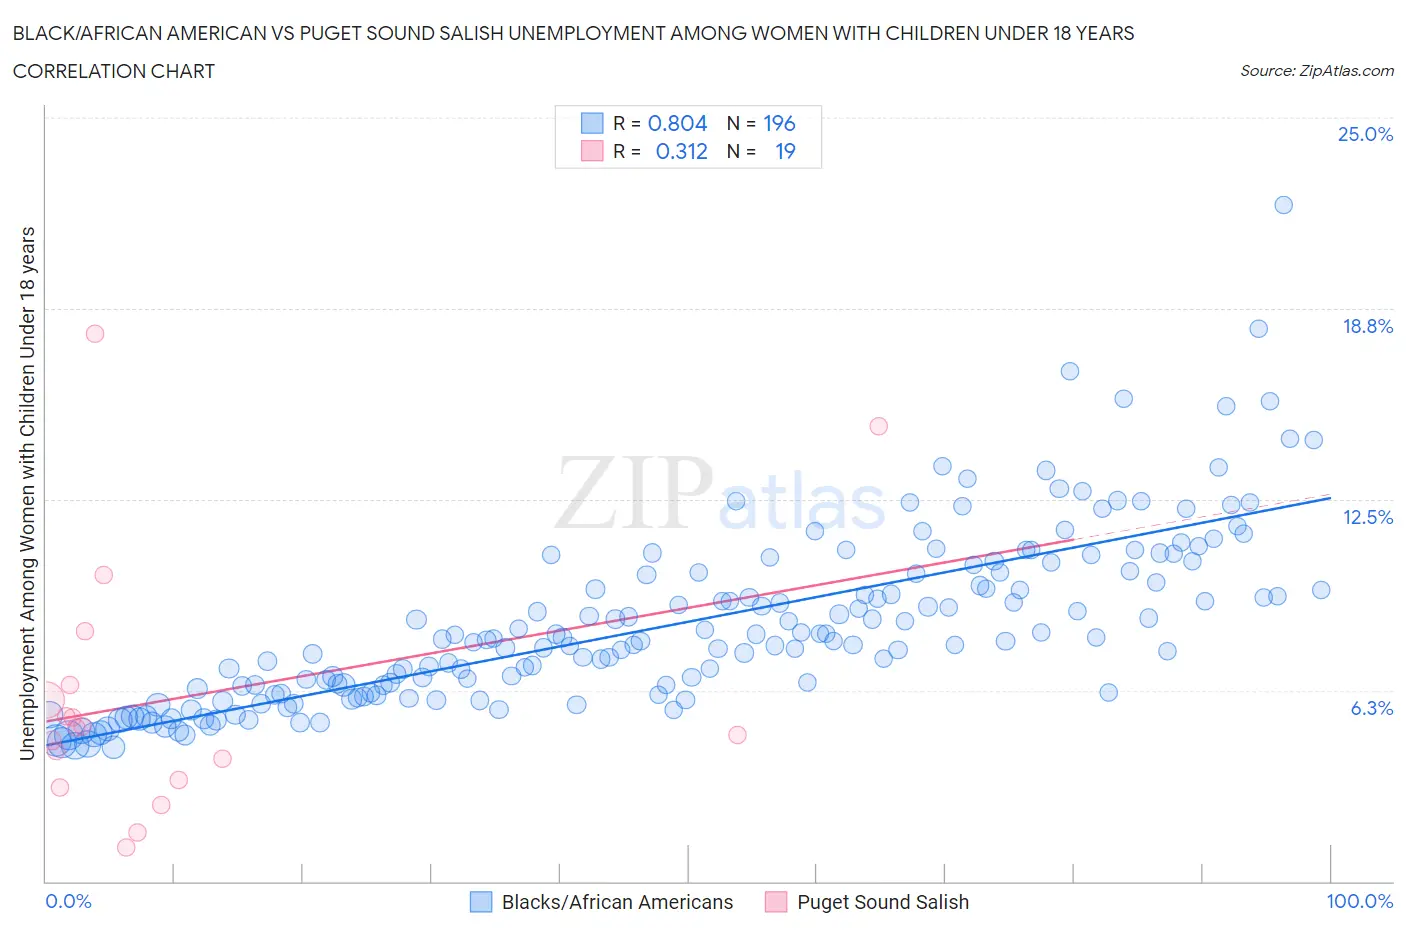
Black/African American vs Puget Sound Salish Unemployment Among Women with Children Under 18 years Correlation Chart
The statistical analysis conducted on geographies consisting of 516,708,014 people shows a very strong positive correlation between the proportion of Blacks/African Americans and unemployment rate among women with children under the age of 18 in the United States with a correlation coefficient (R) of 0.804 and weighted average of 7.3%. Similarly, the statistical analysis conducted on geographies consisting of 45,346,755 people shows a mild positive correlation between the proportion of Puget Sound Salish and unemployment rate among women with children under the age of 18 in the United States with a correlation coefficient (R) of 0.312 and weighted average of 5.1%, a difference of 41.5%.
Unemployment Among Women with Children Under 18 years Correlation Summary
| Measurement | Black/African American | Puget Sound Salish |
| Minimum | 4.4% | 1.1% |
| Maximum | 22.1% | 17.9% |
| Range | 17.7% | 16.8% |
| Mean | 8.4% | 6.0% |
| Median | 7.9% | 5.0% |
| Interquartile 25% (IQ1) | 6.2% | 3.3% |
| Interquartile 75% (IQ3) | 10.1% | 6.4% |
| Interquartile Range (IQR) | 3.9% | 3.1% |
| Standard Deviation (Sample) | 2.9% | 4.3% |
| Standard Deviation (Population) | 2.9% | 4.1% |
Similar Demographics by Unemployment Among Women with Children Under 18 years
Demographics Similar to Blacks/African Americans by Unemployment Among Women with Children Under 18 years
In terms of unemployment among women with children under 18 years, the demographic groups most similar to Blacks/African Americans are Native/Alaskan (7.2%, a difference of 0.41%), Colville (7.4%, a difference of 1.5%), Hopi (7.4%, a difference of 2.0%), Dominican (7.5%, a difference of 2.6%), and Lumbee (7.1%, a difference of 2.8%).
| Demographics | Rating | Rank | Unemployment Among Women with Children Under 18 years |
| Houma | 0.0 /100 | #322 | Tragic 6.8% |
| Pueblo | 0.0 /100 | #323 | Tragic 6.8% |
| Paiute | 0.0 /100 | #324 | Tragic 6.9% |
| Immigrants | Dominica | 0.0 /100 | #325 | Tragic 7.0% |
| Chippewa | 0.0 /100 | #326 | Tragic 7.0% |
| Lumbee | 0.0 /100 | #327 | Tragic 7.1% |
| Natives/Alaskans | 0.0 /100 | #328 | Tragic 7.2% |
| Blacks/African Americans | 0.0 /100 | #329 | Tragic 7.3% |
| Colville | 0.0 /100 | #330 | Tragic 7.4% |
| Hopi | 0.0 /100 | #331 | Tragic 7.4% |
| Dominicans | 0.0 /100 | #332 | Tragic 7.5% |
| Immigrants | Dominican Republic | 0.0 /100 | #333 | Tragic 7.5% |
| Cheyenne | 0.0 /100 | #334 | Tragic 7.8% |
| Apache | 0.0 /100 | #335 | Tragic 7.9% |
| Sioux | 0.0 /100 | #336 | Tragic 7.9% |
Demographics Similar to Puget Sound Salish by Unemployment Among Women with Children Under 18 years
In terms of unemployment among women with children under 18 years, the demographic groups most similar to Puget Sound Salish are Zimbabwean (5.1%, a difference of 0.020%), Immigrants from Asia (5.1%, a difference of 0.030%), Assyrian/Chaldean/Syriac (5.1%, a difference of 0.040%), Immigrants from Northern Europe (5.1%, a difference of 0.060%), and Immigrants from Croatia (5.1%, a difference of 0.060%).
| Demographics | Rating | Rank | Unemployment Among Women with Children Under 18 years |
| Austrians | 96.6 /100 | #69 | Exceptional 5.1% |
| Icelanders | 96.6 /100 | #70 | Exceptional 5.1% |
| Serbians | 96.5 /100 | #71 | Exceptional 5.1% |
| Immigrants | Bolivia | 96.1 /100 | #72 | Exceptional 5.1% |
| Albanians | 95.9 /100 | #73 | Exceptional 5.1% |
| Immigrants | Northern Europe | 95.9 /100 | #74 | Exceptional 5.1% |
| Immigrants | Asia | 95.8 /100 | #75 | Exceptional 5.1% |
| Puget Sound Salish | 95.8 /100 | #76 | Exceptional 5.1% |
| Zimbabweans | 95.7 /100 | #77 | Exceptional 5.1% |
| Assyrians/Chaldeans/Syriacs | 95.7 /100 | #78 | Exceptional 5.1% |
| Immigrants | Croatia | 95.6 /100 | #79 | Exceptional 5.1% |
| Bolivians | 95.5 /100 | #80 | Exceptional 5.1% |
| Immigrants | Lithuania | 95.4 /100 | #81 | Exceptional 5.2% |
| Romanians | 95.3 /100 | #82 | Exceptional 5.2% |
| Maltese | 95.1 /100 | #83 | Exceptional 5.2% |