Black/African American vs Cree Disability Age 65 to 74
COMPARE
Black/African American
Cree
Disability Age 65 to 74
Disability Age 65 to 74 Comparison
Blacks/African Americans
Cree
27.3%
DISABILITY AGE 65 TO 74
0.0/ 100
METRIC RATING
306th/ 347
METRIC RANK
25.9%
DISABILITY AGE 65 TO 74
0.1/ 100
METRIC RATING
280th/ 347
METRIC RANK
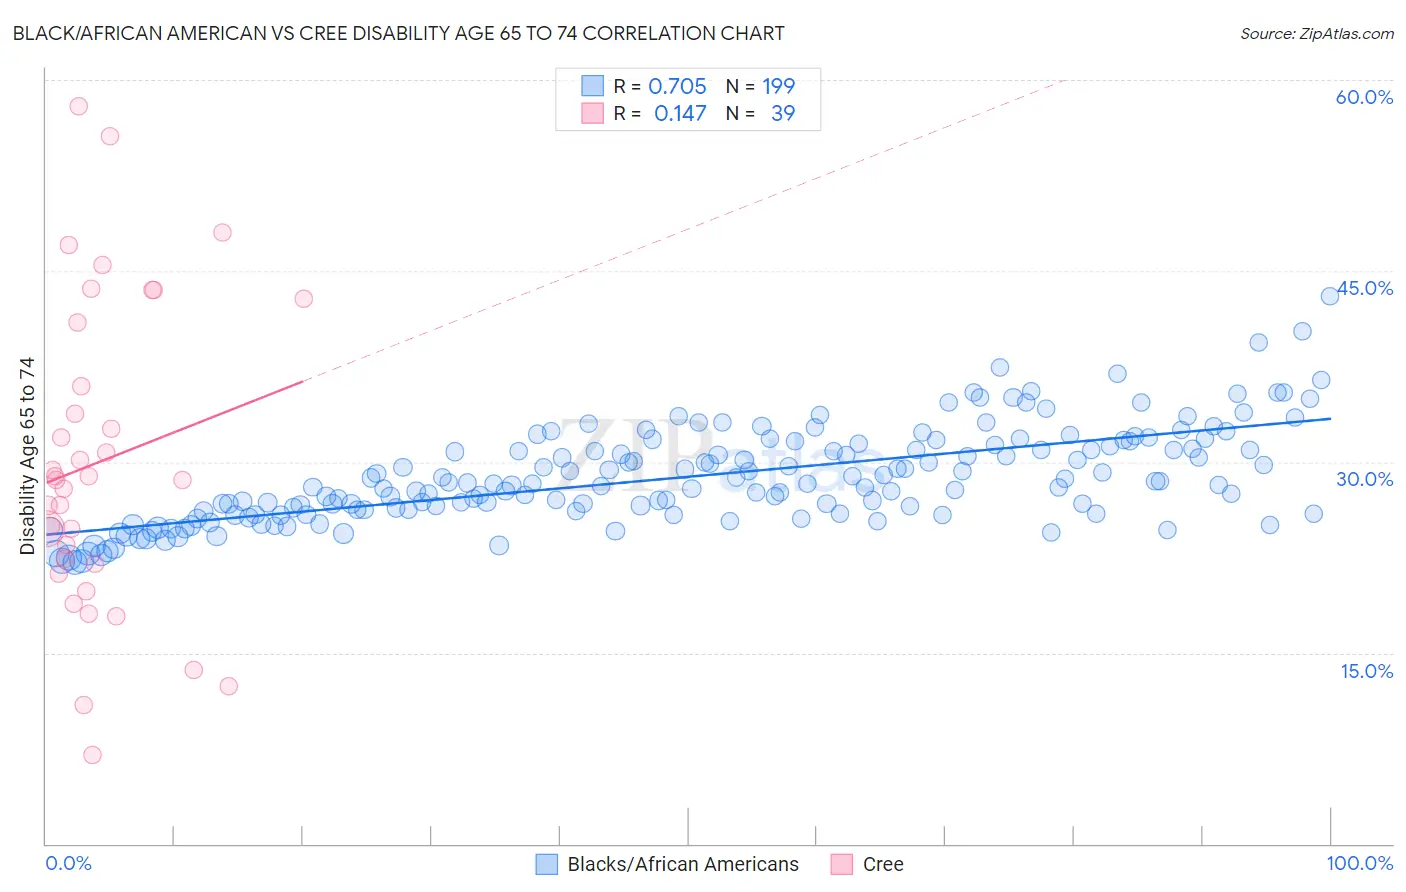
Black/African American vs Cree Disability Age 65 to 74 Correlation Chart
The statistical analysis conducted on geographies consisting of 563,649,388 people shows a strong positive correlation between the proportion of Blacks/African Americans and percentage of population with a disability between the ages 65 and 75 in the United States with a correlation coefficient (R) of 0.705 and weighted average of 27.3%. Similarly, the statistical analysis conducted on geographies consisting of 76,196,128 people shows a poor positive correlation between the proportion of Cree and percentage of population with a disability between the ages 65 and 75 in the United States with a correlation coefficient (R) of 0.147 and weighted average of 25.9%, a difference of 5.4%.
Disability Age 65 to 74 Correlation Summary
| Measurement | Black/African American | Cree |
| Minimum | 22.1% | 7.0% |
| Maximum | 43.0% | 57.9% |
| Range | 20.9% | 50.9% |
| Mean | 28.8% | 30.0% |
| Median | 28.2% | 28.6% |
| Interquartile 25% (IQ1) | 26.1% | 22.0% |
| Interquartile 75% (IQ3) | 31.3% | 40.9% |
| Interquartile Range (IQR) | 5.2% | 18.9% |
| Standard Deviation (Sample) | 3.7% | 12.1% |
| Standard Deviation (Population) | 3.7% | 11.9% |
Similar Demographics by Disability Age 65 to 74
Demographics Similar to Blacks/African Americans by Disability Age 65 to 74
In terms of disability age 65 to 74, the demographic groups most similar to Blacks/African Americans are Ute (27.3%, a difference of 0.060%), Sioux (27.3%, a difference of 0.21%), Yaqui (27.4%, a difference of 0.27%), Shoshone (27.4%, a difference of 0.32%), and Mexican (27.2%, a difference of 0.40%).
| Demographics | Rating | Rank | Disability Age 65 to 74 |
| Potawatomi | 0.0 /100 | #299 | Tragic 27.0% |
| Immigrants | Dominican Republic | 0.0 /100 | #300 | Tragic 27.0% |
| Immigrants | Mexico | 0.0 /100 | #301 | Tragic 27.1% |
| Central American Indians | 0.0 /100 | #302 | Tragic 27.1% |
| Tlingit-Haida | 0.0 /100 | #303 | Tragic 27.1% |
| Puget Sound Salish | 0.0 /100 | #304 | Tragic 27.2% |
| Mexicans | 0.0 /100 | #305 | Tragic 27.2% |
| Blacks/African Americans | 0.0 /100 | #306 | Tragic 27.3% |
| Ute | 0.0 /100 | #307 | Tragic 27.3% |
| Sioux | 0.0 /100 | #308 | Tragic 27.3% |
| Yaqui | 0.0 /100 | #309 | Tragic 27.4% |
| Shoshone | 0.0 /100 | #310 | Tragic 27.4% |
| Menominee | 0.0 /100 | #311 | Tragic 27.4% |
| Osage | 0.0 /100 | #312 | Tragic 27.5% |
| Paiute | 0.0 /100 | #313 | Tragic 27.8% |
Demographics Similar to Cree by Disability Age 65 to 74
In terms of disability age 65 to 74, the demographic groups most similar to Cree are Immigrants from Honduras (25.9%, a difference of 0.020%), U.S. Virgin Islander (25.9%, a difference of 0.080%), Delaware (25.9%, a difference of 0.090%), Immigrants from Belize (25.8%, a difference of 0.16%), and Belizean (25.8%, a difference of 0.18%).
| Demographics | Rating | Rank | Disability Age 65 to 74 |
| Japanese | 0.1 /100 | #273 | Tragic 25.7% |
| Americans | 0.1 /100 | #274 | Tragic 25.8% |
| Hondurans | 0.1 /100 | #275 | Tragic 25.8% |
| French American Indians | 0.1 /100 | #276 | Tragic 25.8% |
| Belizeans | 0.1 /100 | #277 | Tragic 25.8% |
| Immigrants | Belize | 0.1 /100 | #278 | Tragic 25.8% |
| U.S. Virgin Islanders | 0.1 /100 | #279 | Tragic 25.9% |
| Cree | 0.1 /100 | #280 | Tragic 25.9% |
| Immigrants | Honduras | 0.1 /100 | #281 | Tragic 25.9% |
| Delaware | 0.1 /100 | #282 | Tragic 25.9% |
| Spanish Americans | 0.0 /100 | #283 | Tragic 25.9% |
| Immigrants | Azores | 0.0 /100 | #284 | Tragic 26.0% |
| Immigrants | Congo | 0.0 /100 | #285 | Tragic 26.0% |
| Immigrants | Micronesia | 0.0 /100 | #286 | Tragic 26.1% |
| Immigrants | Laos | 0.0 /100 | #287 | Tragic 26.1% |