Black/African American vs Croatian Disability Age 65 to 74
COMPARE
Black/African American
Croatian
Disability Age 65 to 74
Disability Age 65 to 74 Comparison
Blacks/African Americans
Croatians
27.3%
DISABILITY AGE 65 TO 74
0.0/ 100
METRIC RATING
306th/ 347
METRIC RANK
21.8%
DISABILITY AGE 65 TO 74
98.9/ 100
METRIC RATING
81st/ 347
METRIC RANK
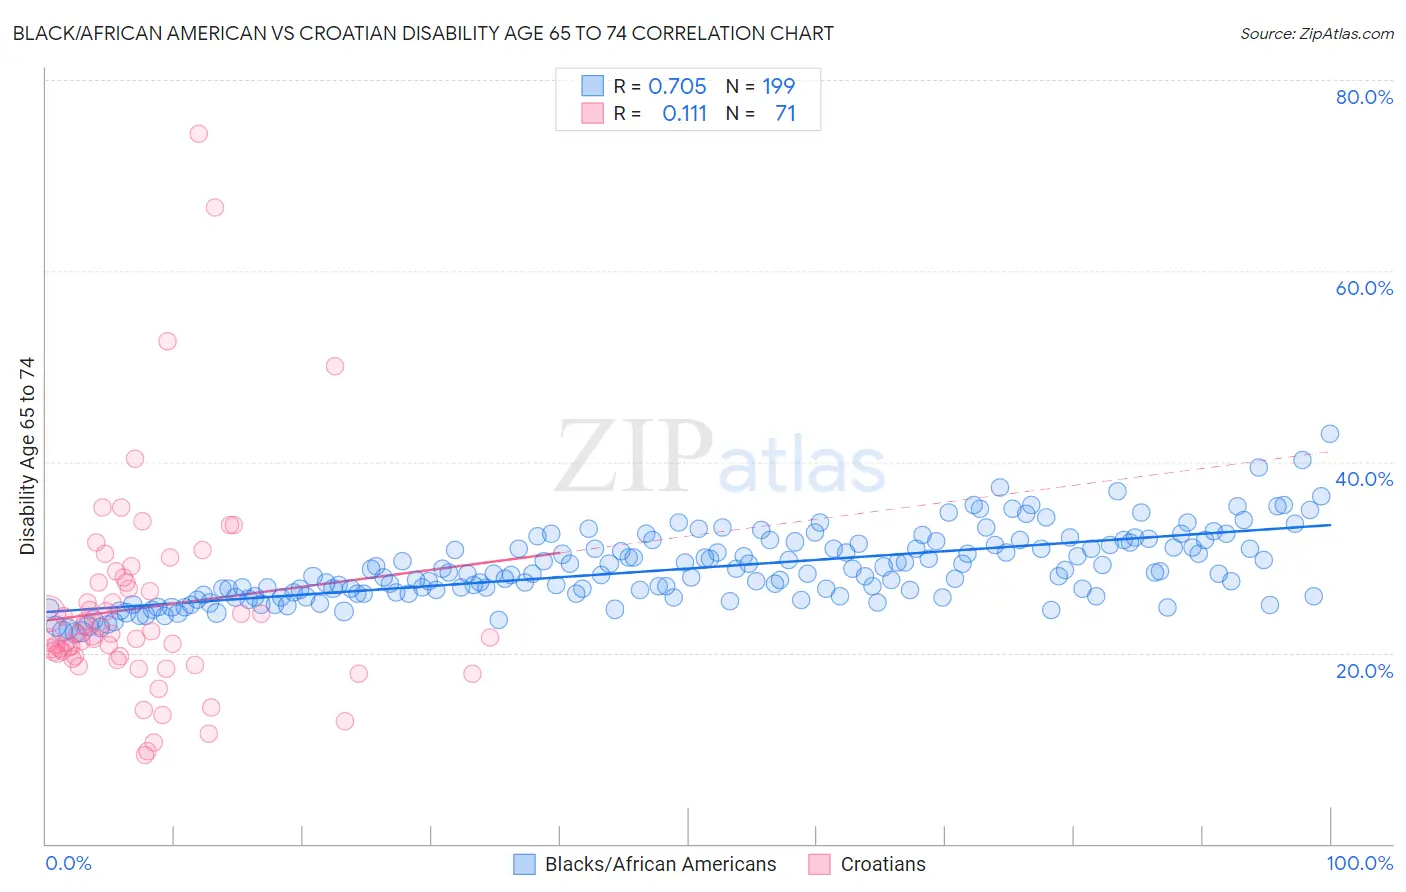
Black/African American vs Croatian Disability Age 65 to 74 Correlation Chart
The statistical analysis conducted on geographies consisting of 563,649,388 people shows a strong positive correlation between the proportion of Blacks/African Americans and percentage of population with a disability between the ages 65 and 75 in the United States with a correlation coefficient (R) of 0.705 and weighted average of 27.3%. Similarly, the statistical analysis conducted on geographies consisting of 375,202,419 people shows a poor positive correlation between the proportion of Croatians and percentage of population with a disability between the ages 65 and 75 in the United States with a correlation coefficient (R) of 0.111 and weighted average of 21.8%, a difference of 25.1%.
Disability Age 65 to 74 Correlation Summary
| Measurement | Black/African American | Croatian |
| Minimum | 22.1% | 9.4% |
| Maximum | 43.0% | 74.4% |
| Range | 20.9% | 65.1% |
| Mean | 28.8% | 24.7% |
| Median | 28.2% | 21.8% |
| Interquartile 25% (IQ1) | 26.1% | 19.6% |
| Interquartile 75% (IQ3) | 31.3% | 27.4% |
| Interquartile Range (IQR) | 5.2% | 7.8% |
| Standard Deviation (Sample) | 3.7% | 11.1% |
| Standard Deviation (Population) | 3.7% | 11.0% |
Similar Demographics by Disability Age 65 to 74
Demographics Similar to Blacks/African Americans by Disability Age 65 to 74
In terms of disability age 65 to 74, the demographic groups most similar to Blacks/African Americans are Ute (27.3%, a difference of 0.060%), Sioux (27.3%, a difference of 0.21%), Yaqui (27.4%, a difference of 0.27%), Shoshone (27.4%, a difference of 0.32%), and Mexican (27.2%, a difference of 0.40%).
| Demographics | Rating | Rank | Disability Age 65 to 74 |
| Potawatomi | 0.0 /100 | #299 | Tragic 27.0% |
| Immigrants | Dominican Republic | 0.0 /100 | #300 | Tragic 27.0% |
| Immigrants | Mexico | 0.0 /100 | #301 | Tragic 27.1% |
| Central American Indians | 0.0 /100 | #302 | Tragic 27.1% |
| Tlingit-Haida | 0.0 /100 | #303 | Tragic 27.1% |
| Puget Sound Salish | 0.0 /100 | #304 | Tragic 27.2% |
| Mexicans | 0.0 /100 | #305 | Tragic 27.2% |
| Blacks/African Americans | 0.0 /100 | #306 | Tragic 27.3% |
| Ute | 0.0 /100 | #307 | Tragic 27.3% |
| Sioux | 0.0 /100 | #308 | Tragic 27.3% |
| Yaqui | 0.0 /100 | #309 | Tragic 27.4% |
| Shoshone | 0.0 /100 | #310 | Tragic 27.4% |
| Menominee | 0.0 /100 | #311 | Tragic 27.4% |
| Osage | 0.0 /100 | #312 | Tragic 27.5% |
| Paiute | 0.0 /100 | #313 | Tragic 27.8% |
Demographics Similar to Croatians by Disability Age 65 to 74
In terms of disability age 65 to 74, the demographic groups most similar to Croatians are Immigrants from Norway (21.8%, a difference of 0.070%), Immigrants from Eastern Europe (21.8%, a difference of 0.080%), Venezuelan (21.8%, a difference of 0.080%), Immigrants from Poland (21.8%, a difference of 0.14%), and Greek (21.8%, a difference of 0.20%).
| Demographics | Rating | Rank | Disability Age 65 to 74 |
| Cambodians | 99.0 /100 | #74 | Exceptional 21.8% |
| Mongolians | 99.0 /100 | #75 | Exceptional 21.8% |
| Greeks | 99.0 /100 | #76 | Exceptional 21.8% |
| Immigrants | Poland | 99.0 /100 | #77 | Exceptional 21.8% |
| Immigrants | Eastern Europe | 99.0 /100 | #78 | Exceptional 21.8% |
| Venezuelans | 99.0 /100 | #79 | Exceptional 21.8% |
| Immigrants | Norway | 98.9 /100 | #80 | Exceptional 21.8% |
| Croatians | 98.9 /100 | #81 | Exceptional 21.8% |
| Immigrants | Indonesia | 98.7 /100 | #82 | Exceptional 21.9% |
| Immigrants | Brazil | 98.5 /100 | #83 | Exceptional 21.9% |
| Immigrants | Spain | 98.5 /100 | #84 | Exceptional 21.9% |
| Immigrants | Lebanon | 98.4 /100 | #85 | Exceptional 21.9% |
| South Africans | 98.4 /100 | #86 | Exceptional 21.9% |
| Australians | 98.0 /100 | #87 | Exceptional 22.0% |
| Immigrants | Netherlands | 97.9 /100 | #88 | Exceptional 22.0% |