Black/African American vs Puget Sound Salish In Labor Force | Age 35-44
COMPARE
Black/African American
Puget Sound Salish
In Labor Force | Age 35-44
In Labor Force | Age 35-44 Comparison
Blacks/African Americans
Puget Sound Salish
82.2%
IN LABOR FORCE | AGE 35-44
0.0/ 100
METRIC RATING
306th/ 347
METRIC RANK
82.9%
IN LABOR FORCE | AGE 35-44
0.0/ 100
METRIC RATING
288th/ 347
METRIC RANK
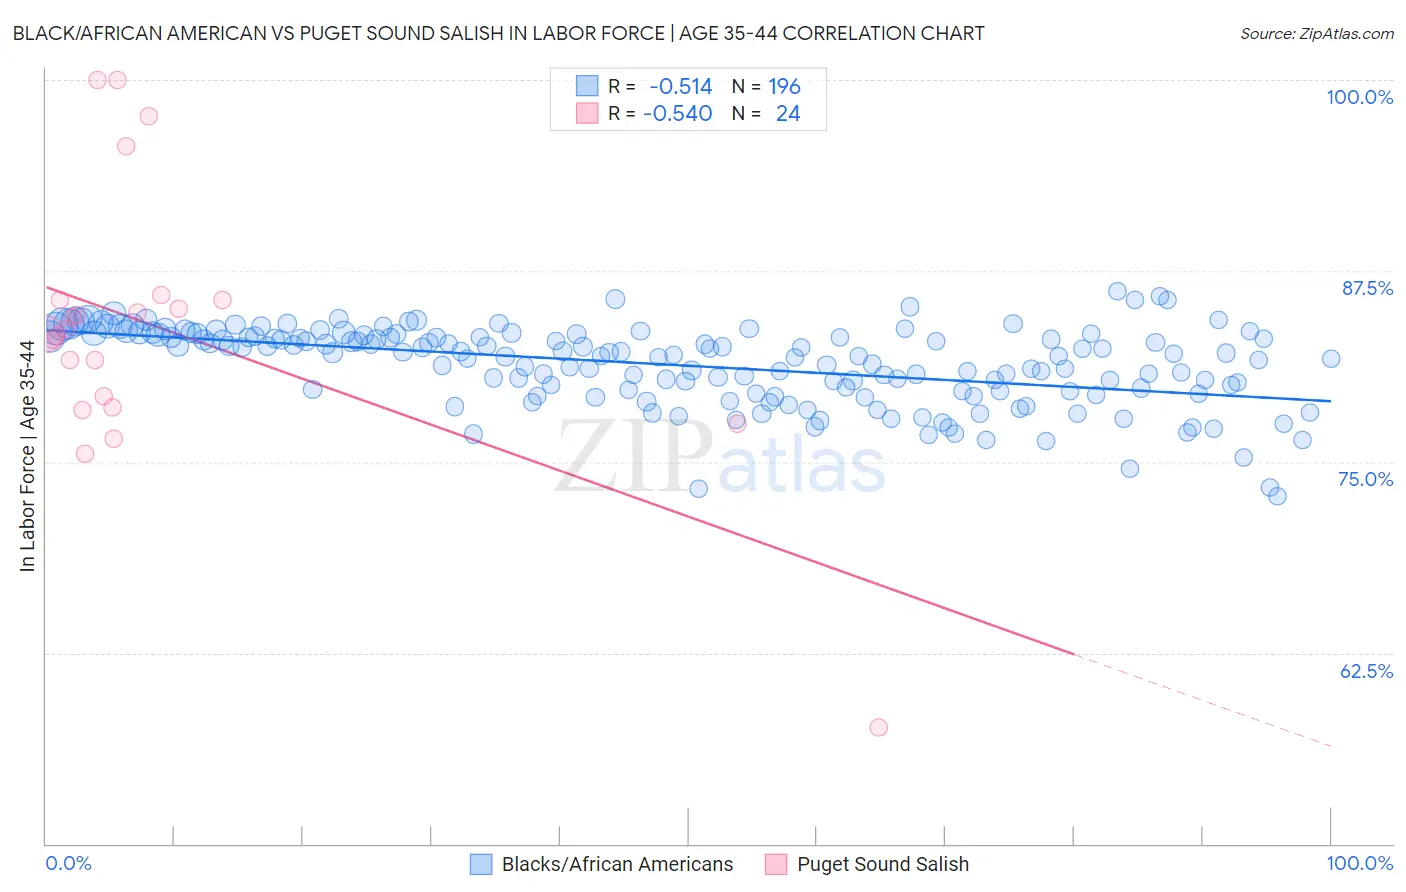
Black/African American vs Puget Sound Salish In Labor Force | Age 35-44 Correlation Chart
The statistical analysis conducted on geographies consisting of 565,288,812 people shows a substantial negative correlation between the proportion of Blacks/African Americans and labor force participation rate among population between the ages 35 and 44 in the United States with a correlation coefficient (R) of -0.514 and weighted average of 82.2%. Similarly, the statistical analysis conducted on geographies consisting of 46,155,509 people shows a substantial negative correlation between the proportion of Puget Sound Salish and labor force participation rate among population between the ages 35 and 44 in the United States with a correlation coefficient (R) of -0.540 and weighted average of 82.9%, a difference of 0.91%.
In Labor Force | Age 35-44 Correlation Summary
| Measurement | Black/African American | Puget Sound Salish |
| Minimum | 72.8% | 57.6% |
| Maximum | 86.2% | 100.0% |
| Range | 13.4% | 42.4% |
| Mean | 81.3% | 83.7% |
| Median | 82.0% | 83.6% |
| Interquartile 25% (IQ1) | 79.6% | 78.9% |
| Interquartile 75% (IQ3) | 83.2% | 85.6% |
| Interquartile Range (IQR) | 3.6% | 6.6% |
| Standard Deviation (Sample) | 2.6% | 8.9% |
| Standard Deviation (Population) | 2.6% | 8.7% |
Demographics Similar to Blacks/African Americans and Puget Sound Salish by In Labor Force | Age 35-44
In terms of in labor force | age 35-44, the demographic groups most similar to Blacks/African Americans are Shoshone (82.2%, a difference of 0.020%), Hispanic or Latino (82.1%, a difference of 0.10%), Marshallese (82.4%, a difference of 0.29%), American (82.4%, a difference of 0.30%), and Nepalese (82.4%, a difference of 0.30%). Similarly, the demographic groups most similar to Puget Sound Salish are Chippewa (82.9%, a difference of 0.010%), Immigrants from Belize (82.9%, a difference of 0.020%), African (82.9%, a difference of 0.030%), Pennsylvania German (82.9%, a difference of 0.040%), and Immigrants from Latin America (82.8%, a difference of 0.090%).
| Demographics | Rating | Rank | In Labor Force | Age 35-44 |
| Immigrants | Belize | 0.0 /100 | #287 | Tragic 82.9% |
| Puget Sound Salish | 0.0 /100 | #288 | Tragic 82.9% |
| Chippewa | 0.0 /100 | #289 | Tragic 82.9% |
| Africans | 0.0 /100 | #290 | Tragic 82.9% |
| Pennsylvania Germans | 0.0 /100 | #291 | Tragic 82.9% |
| Immigrants | Latin America | 0.0 /100 | #292 | Tragic 82.8% |
| Spanish Americans | 0.0 /100 | #293 | Tragic 82.8% |
| Potawatomi | 0.0 /100 | #294 | Tragic 82.7% |
| Immigrants | Lebanon | 0.0 /100 | #295 | Tragic 82.7% |
| Mexican American Indians | 0.0 /100 | #296 | Tragic 82.6% |
| Hmong | 0.0 /100 | #297 | Tragic 82.6% |
| Ottawa | 0.0 /100 | #298 | Tragic 82.6% |
| Tlingit-Haida | 0.0 /100 | #299 | Tragic 82.5% |
| Central American Indians | 0.0 /100 | #300 | Tragic 82.5% |
| Spanish American Indians | 0.0 /100 | #301 | Tragic 82.5% |
| Americans | 0.0 /100 | #302 | Tragic 82.4% |
| Nepalese | 0.0 /100 | #303 | Tragic 82.4% |
| Marshallese | 0.0 /100 | #304 | Tragic 82.4% |
| Shoshone | 0.0 /100 | #305 | Tragic 82.2% |
| Blacks/African Americans | 0.0 /100 | #306 | Tragic 82.2% |
| Hispanics or Latinos | 0.0 /100 | #307 | Tragic 82.1% |