Black/African American vs Welsh Disability Age 65 to 74
COMPARE
Black/African American
Welsh
Disability Age 65 to 74
Disability Age 65 to 74 Comparison
Blacks/African Americans
Welsh
27.3%
DISABILITY AGE 65 TO 74
0.0/ 100
METRIC RATING
306th/ 347
METRIC RANK
23.7%
DISABILITY AGE 65 TO 74
24.3/ 100
METRIC RATING
199th/ 347
METRIC RANK
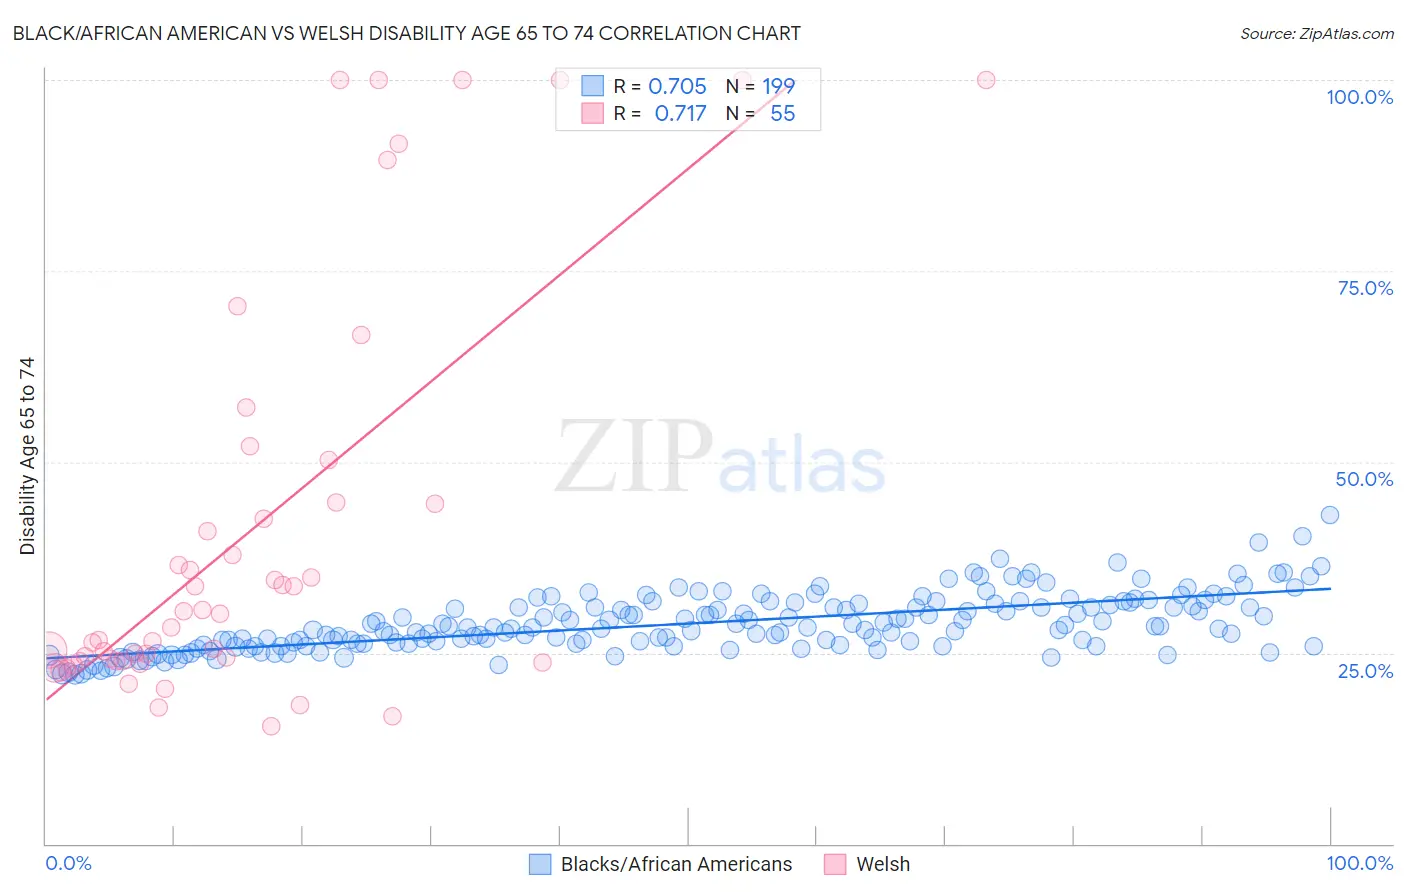
Black/African American vs Welsh Disability Age 65 to 74 Correlation Chart
The statistical analysis conducted on geographies consisting of 563,649,388 people shows a strong positive correlation between the proportion of Blacks/African Americans and percentage of population with a disability between the ages 65 and 75 in the United States with a correlation coefficient (R) of 0.705 and weighted average of 27.3%. Similarly, the statistical analysis conducted on geographies consisting of 527,009,615 people shows a strong positive correlation between the proportion of Welsh and percentage of population with a disability between the ages 65 and 75 in the United States with a correlation coefficient (R) of 0.717 and weighted average of 23.7%, a difference of 15.0%.
Disability Age 65 to 74 Correlation Summary
| Measurement | Black/African American | Welsh |
| Minimum | 22.1% | 15.4% |
| Maximum | 43.0% | 100.0% |
| Range | 20.9% | 84.6% |
| Mean | 28.8% | 40.9% |
| Median | 28.2% | 30.1% |
| Interquartile 25% (IQ1) | 26.1% | 23.9% |
| Interquartile 75% (IQ3) | 31.3% | 44.6% |
| Interquartile Range (IQR) | 5.2% | 20.8% |
| Standard Deviation (Sample) | 3.7% | 26.3% |
| Standard Deviation (Population) | 3.7% | 26.0% |
Similar Demographics by Disability Age 65 to 74
Demographics Similar to Blacks/African Americans by Disability Age 65 to 74
In terms of disability age 65 to 74, the demographic groups most similar to Blacks/African Americans are Ute (27.3%, a difference of 0.060%), Sioux (27.3%, a difference of 0.21%), Yaqui (27.4%, a difference of 0.27%), Shoshone (27.4%, a difference of 0.32%), and Mexican (27.2%, a difference of 0.40%).
| Demographics | Rating | Rank | Disability Age 65 to 74 |
| Potawatomi | 0.0 /100 | #299 | Tragic 27.0% |
| Immigrants | Dominican Republic | 0.0 /100 | #300 | Tragic 27.0% |
| Immigrants | Mexico | 0.0 /100 | #301 | Tragic 27.1% |
| Central American Indians | 0.0 /100 | #302 | Tragic 27.1% |
| Tlingit-Haida | 0.0 /100 | #303 | Tragic 27.1% |
| Puget Sound Salish | 0.0 /100 | #304 | Tragic 27.2% |
| Mexicans | 0.0 /100 | #305 | Tragic 27.2% |
| Blacks/African Americans | 0.0 /100 | #306 | Tragic 27.3% |
| Ute | 0.0 /100 | #307 | Tragic 27.3% |
| Sioux | 0.0 /100 | #308 | Tragic 27.3% |
| Yaqui | 0.0 /100 | #309 | Tragic 27.4% |
| Shoshone | 0.0 /100 | #310 | Tragic 27.4% |
| Menominee | 0.0 /100 | #311 | Tragic 27.4% |
| Osage | 0.0 /100 | #312 | Tragic 27.5% |
| Paiute | 0.0 /100 | #313 | Tragic 27.8% |
Demographics Similar to Welsh by Disability Age 65 to 74
In terms of disability age 65 to 74, the demographic groups most similar to Welsh are Immigrants from Africa (23.7%, a difference of 0.010%), French Canadian (23.7%, a difference of 0.030%), Immigrants from Ecuador (23.7%, a difference of 0.040%), Immigrants from Bahamas (23.7%, a difference of 0.080%), and Kenyan (23.7%, a difference of 0.090%).
| Demographics | Rating | Rank | Disability Age 65 to 74 |
| Ecuadorians | 29.7 /100 | #192 | Fair 23.6% |
| English | 28.5 /100 | #193 | Fair 23.6% |
| Sudanese | 27.8 /100 | #194 | Fair 23.7% |
| Immigrants | St. Vincent and the Grenadines | 26.1 /100 | #195 | Fair 23.7% |
| Immigrants | Trinidad and Tobago | 26.1 /100 | #196 | Fair 23.7% |
| Immigrants | Immigrants | 25.8 /100 | #197 | Fair 23.7% |
| Immigrants | Africa | 24.4 /100 | #198 | Fair 23.7% |
| Welsh | 24.3 /100 | #199 | Fair 23.7% |
| French Canadians | 24.0 /100 | #200 | Fair 23.7% |
| Immigrants | Ecuador | 23.9 /100 | #201 | Fair 23.7% |
| Immigrants | Bahamas | 23.3 /100 | #202 | Fair 23.7% |
| Kenyans | 23.2 /100 | #203 | Fair 23.7% |
| Immigrants | Grenada | 22.1 /100 | #204 | Fair 23.8% |
| Tongans | 20.8 /100 | #205 | Fair 23.8% |
| Immigrants | Jamaica | 20.7 /100 | #206 | Fair 23.8% |