Black/African American vs Latvian Disability Age 65 to 74
COMPARE
Black/African American
Latvian
Disability Age 65 to 74
Disability Age 65 to 74 Comparison
Blacks/African Americans
Latvians
27.3%
DISABILITY AGE 65 TO 74
0.0/ 100
METRIC RATING
306th/ 347
METRIC RANK
21.2%
DISABILITY AGE 65 TO 74
99.8/ 100
METRIC RATING
40th/ 347
METRIC RANK
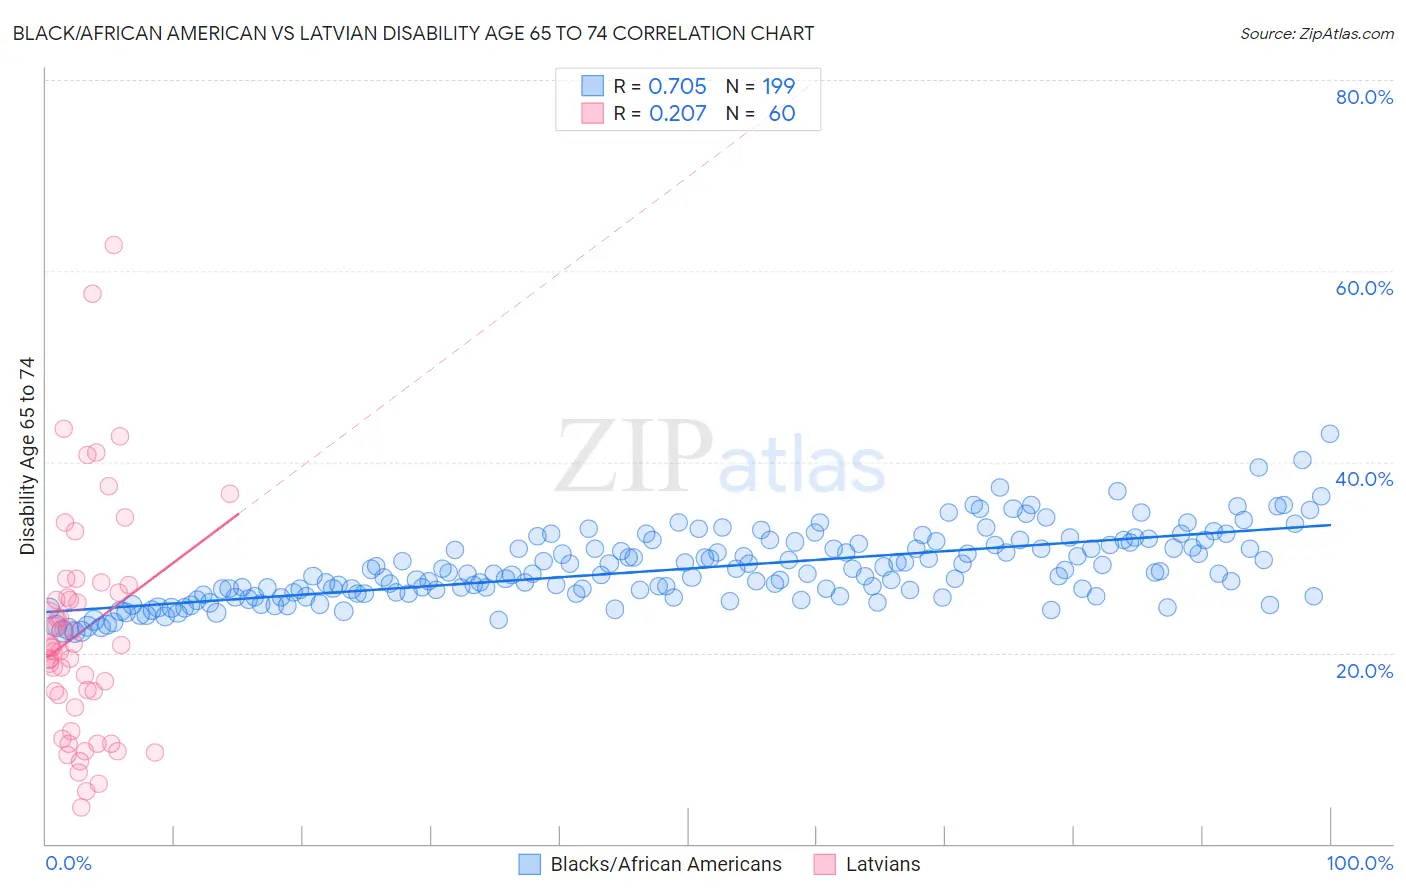
Black/African American vs Latvian Disability Age 65 to 74 Correlation Chart
The statistical analysis conducted on geographies consisting of 563,649,388 people shows a strong positive correlation between the proportion of Blacks/African Americans and percentage of population with a disability between the ages 65 and 75 in the United States with a correlation coefficient (R) of 0.705 and weighted average of 27.3%. Similarly, the statistical analysis conducted on geographies consisting of 220,453,465 people shows a weak positive correlation between the proportion of Latvians and percentage of population with a disability between the ages 65 and 75 in the United States with a correlation coefficient (R) of 0.207 and weighted average of 21.2%, a difference of 28.6%.
Disability Age 65 to 74 Correlation Summary
| Measurement | Black/African American | Latvian |
| Minimum | 22.1% | 3.8% |
| Maximum | 43.0% | 62.7% |
| Range | 20.9% | 58.9% |
| Mean | 28.8% | 22.2% |
| Median | 28.2% | 20.6% |
| Interquartile 25% (IQ1) | 26.1% | 14.9% |
| Interquartile 75% (IQ3) | 31.3% | 26.7% |
| Interquartile Range (IQR) | 5.2% | 11.7% |
| Standard Deviation (Sample) | 3.7% | 11.9% |
| Standard Deviation (Population) | 3.7% | 11.8% |
Similar Demographics by Disability Age 65 to 74
Demographics Similar to Blacks/African Americans by Disability Age 65 to 74
In terms of disability age 65 to 74, the demographic groups most similar to Blacks/African Americans are Ute (27.3%, a difference of 0.060%), Sioux (27.3%, a difference of 0.21%), Yaqui (27.4%, a difference of 0.27%), Shoshone (27.4%, a difference of 0.32%), and Mexican (27.2%, a difference of 0.40%).
| Demographics | Rating | Rank | Disability Age 65 to 74 |
| Potawatomi | 0.0 /100 | #299 | Tragic 27.0% |
| Immigrants | Dominican Republic | 0.0 /100 | #300 | Tragic 27.0% |
| Immigrants | Mexico | 0.0 /100 | #301 | Tragic 27.1% |
| Central American Indians | 0.0 /100 | #302 | Tragic 27.1% |
| Tlingit-Haida | 0.0 /100 | #303 | Tragic 27.1% |
| Puget Sound Salish | 0.0 /100 | #304 | Tragic 27.2% |
| Mexicans | 0.0 /100 | #305 | Tragic 27.2% |
| Blacks/African Americans | 0.0 /100 | #306 | Tragic 27.3% |
| Ute | 0.0 /100 | #307 | Tragic 27.3% |
| Sioux | 0.0 /100 | #308 | Tragic 27.3% |
| Yaqui | 0.0 /100 | #309 | Tragic 27.4% |
| Shoshone | 0.0 /100 | #310 | Tragic 27.4% |
| Menominee | 0.0 /100 | #311 | Tragic 27.4% |
| Osage | 0.0 /100 | #312 | Tragic 27.5% |
| Paiute | 0.0 /100 | #313 | Tragic 27.8% |
Demographics Similar to Latvians by Disability Age 65 to 74
In terms of disability age 65 to 74, the demographic groups most similar to Latvians are Immigrants from Austria (21.2%, a difference of 0.060%), Argentinean (21.2%, a difference of 0.16%), Israeli (21.2%, a difference of 0.35%), Russian (21.2%, a difference of 0.35%), and Immigrants from Switzerland (21.1%, a difference of 0.46%).
| Demographics | Rating | Rank | Disability Age 65 to 74 |
| Immigrants | Argentina | 99.9 /100 | #33 | Exceptional 21.1% |
| Immigrants | Sri Lanka | 99.9 /100 | #34 | Exceptional 21.1% |
| Bulgarians | 99.9 /100 | #35 | Exceptional 21.1% |
| Immigrants | Switzerland | 99.8 /100 | #36 | Exceptional 21.1% |
| Israelis | 99.8 /100 | #37 | Exceptional 21.2% |
| Russians | 99.8 /100 | #38 | Exceptional 21.2% |
| Argentineans | 99.8 /100 | #39 | Exceptional 21.2% |
| Latvians | 99.8 /100 | #40 | Exceptional 21.2% |
| Immigrants | Austria | 99.8 /100 | #41 | Exceptional 21.2% |
| Macedonians | 99.7 /100 | #42 | Exceptional 21.3% |
| Immigrants | Croatia | 99.7 /100 | #43 | Exceptional 21.3% |
| Estonians | 99.7 /100 | #44 | Exceptional 21.4% |
| Asians | 99.7 /100 | #45 | Exceptional 21.4% |
| Immigrants | Turkey | 99.7 /100 | #46 | Exceptional 21.4% |
| Immigrants | Bulgaria | 99.7 /100 | #47 | Exceptional 21.4% |