Black/African American vs Immigrants from St. Vincent and the Grenadines Disability Age Over 75
COMPARE
Black/African American
Immigrants from St. Vincent and the Grenadines
Disability Age Over 75
Disability Age Over 75 Comparison
Blacks/African Americans
Immigrants from St. Vincent and the Grenadines
49.5%
DISABILITY AGE OVER 75
0.0/ 100
METRIC RATING
282nd/ 347
METRIC RANK
48.2%
DISABILITY AGE OVER 75
3.2/ 100
METRIC RATING
237th/ 347
METRIC RANK
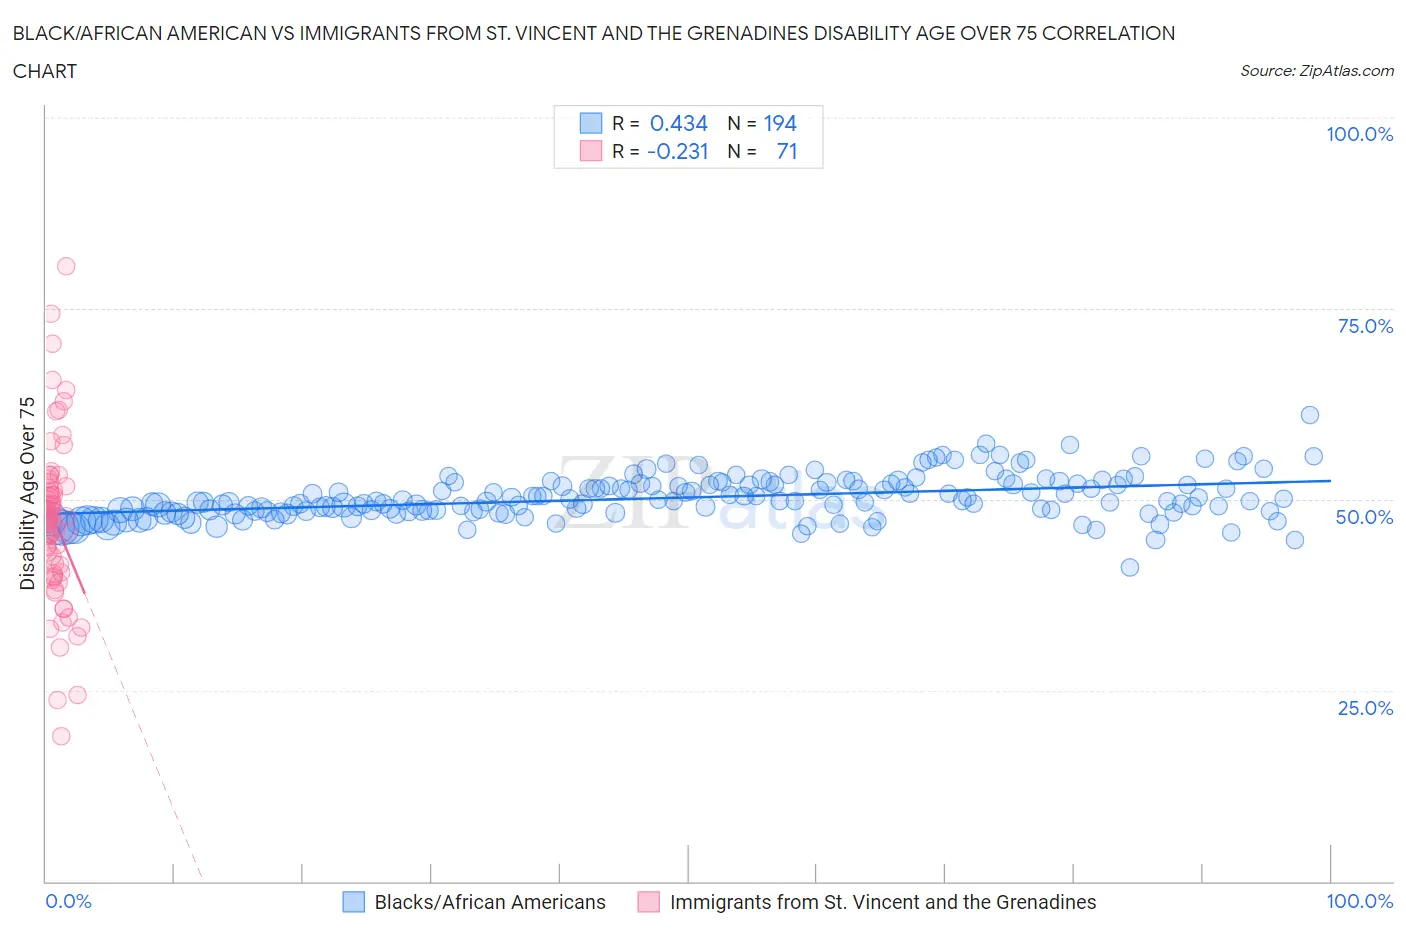
Black/African American vs Immigrants from St. Vincent and the Grenadines Disability Age Over 75 Correlation Chart
The statistical analysis conducted on geographies consisting of 563,629,175 people shows a moderate positive correlation between the proportion of Blacks/African Americans and percentage of population with a disability over the age of 75 in the United States with a correlation coefficient (R) of 0.434 and weighted average of 49.5%. Similarly, the statistical analysis conducted on geographies consisting of 56,132,853 people shows a weak negative correlation between the proportion of Immigrants from St. Vincent and the Grenadines and percentage of population with a disability over the age of 75 in the United States with a correlation coefficient (R) of -0.231 and weighted average of 48.2%, a difference of 2.6%.
Disability Age Over 75 Correlation Summary
| Measurement | Black/African American | Immigrants from St. Vincent and the Grenadines |
| Minimum | 41.1% | 19.0% |
| Maximum | 61.0% | 80.4% |
| Range | 19.9% | 61.5% |
| Mean | 50.2% | 47.0% |
| Median | 49.8% | 47.5% |
| Interquartile 25% (IQ1) | 48.4% | 40.3% |
| Interquartile 75% (IQ3) | 52.0% | 51.8% |
| Interquartile Range (IQR) | 3.6% | 11.4% |
| Standard Deviation (Sample) | 2.8% | 10.9% |
| Standard Deviation (Population) | 2.8% | 10.8% |
Similar Demographics by Disability Age Over 75
Demographics Similar to Blacks/African Americans by Disability Age Over 75
In terms of disability age over 75, the demographic groups most similar to Blacks/African Americans are Samoan (49.5%, a difference of 0.030%), Immigrants from Latin America (49.5%, a difference of 0.080%), Belizean (49.4%, a difference of 0.14%), Bangladeshi (49.4%, a difference of 0.15%), and Guamanian/Chamorro (49.4%, a difference of 0.21%).
| Demographics | Rating | Rank | Disability Age Over 75 |
| Immigrants | Dominica | 0.1 /100 | #275 | Tragic 49.1% |
| Immigrants | Uzbekistan | 0.1 /100 | #276 | Tragic 49.2% |
| Hawaiians | 0.1 /100 | #277 | Tragic 49.2% |
| Immigrants | Laos | 0.1 /100 | #278 | Tragic 49.2% |
| Guamanians/Chamorros | 0.0 /100 | #279 | Tragic 49.4% |
| Bangladeshis | 0.0 /100 | #280 | Tragic 49.4% |
| Belizeans | 0.0 /100 | #281 | Tragic 49.4% |
| Blacks/African Americans | 0.0 /100 | #282 | Tragic 49.5% |
| Samoans | 0.0 /100 | #283 | Tragic 49.5% |
| Immigrants | Latin America | 0.0 /100 | #284 | Tragic 49.5% |
| Crow | 0.0 /100 | #285 | Tragic 49.6% |
| Immigrants | Belize | 0.0 /100 | #286 | Tragic 49.6% |
| Sioux | 0.0 /100 | #287 | Tragic 49.7% |
| Yaqui | 0.0 /100 | #288 | Tragic 49.8% |
| Osage | 0.0 /100 | #289 | Tragic 49.8% |
Demographics Similar to Immigrants from St. Vincent and the Grenadines by Disability Age Over 75
In terms of disability age over 75, the demographic groups most similar to Immigrants from St. Vincent and the Grenadines are Immigrants from Nicaragua (48.2%, a difference of 0.0%), Nicaraguan (48.3%, a difference of 0.030%), Immigrants from Thailand (48.3%, a difference of 0.080%), Subsaharan African (48.2%, a difference of 0.10%), and Hmong (48.2%, a difference of 0.10%).
| Demographics | Rating | Rank | Disability Age Over 75 |
| Taiwanese | 4.4 /100 | #230 | Tragic 48.2% |
| Immigrants | Immigrants | 4.3 /100 | #231 | Tragic 48.2% |
| Indonesians | 4.2 /100 | #232 | Tragic 48.2% |
| Cree | 4.2 /100 | #233 | Tragic 48.2% |
| Sub-Saharan Africans | 3.8 /100 | #234 | Tragic 48.2% |
| Hmong | 3.8 /100 | #235 | Tragic 48.2% |
| Immigrants | Nicaragua | 3.2 /100 | #236 | Tragic 48.2% |
| Immigrants | St. Vincent and the Grenadines | 3.2 /100 | #237 | Tragic 48.2% |
| Nicaraguans | 3.0 /100 | #238 | Tragic 48.3% |
| Immigrants | Thailand | 2.8 /100 | #239 | Tragic 48.3% |
| Tongans | 2.3 /100 | #240 | Tragic 48.3% |
| Native Hawaiians | 2.2 /100 | #241 | Tragic 48.3% |
| French American Indians | 2.2 /100 | #242 | Tragic 48.3% |
| Immigrants | Caribbean | 2.1 /100 | #243 | Tragic 48.4% |
| Afghans | 1.8 /100 | #244 | Tragic 48.4% |