Black/African American vs Soviet Union Disability Age Over 75
COMPARE
Black/African American
Soviet Union
Disability Age Over 75
Disability Age Over 75 Comparison
Blacks/African Americans
Soviet Union
49.5%
DISABILITY AGE OVER 75
0.0/ 100
METRIC RATING
282nd/ 347
METRIC RANK
46.2%
DISABILITY AGE OVER 75
98.8/ 100
METRIC RATING
80th/ 347
METRIC RANK
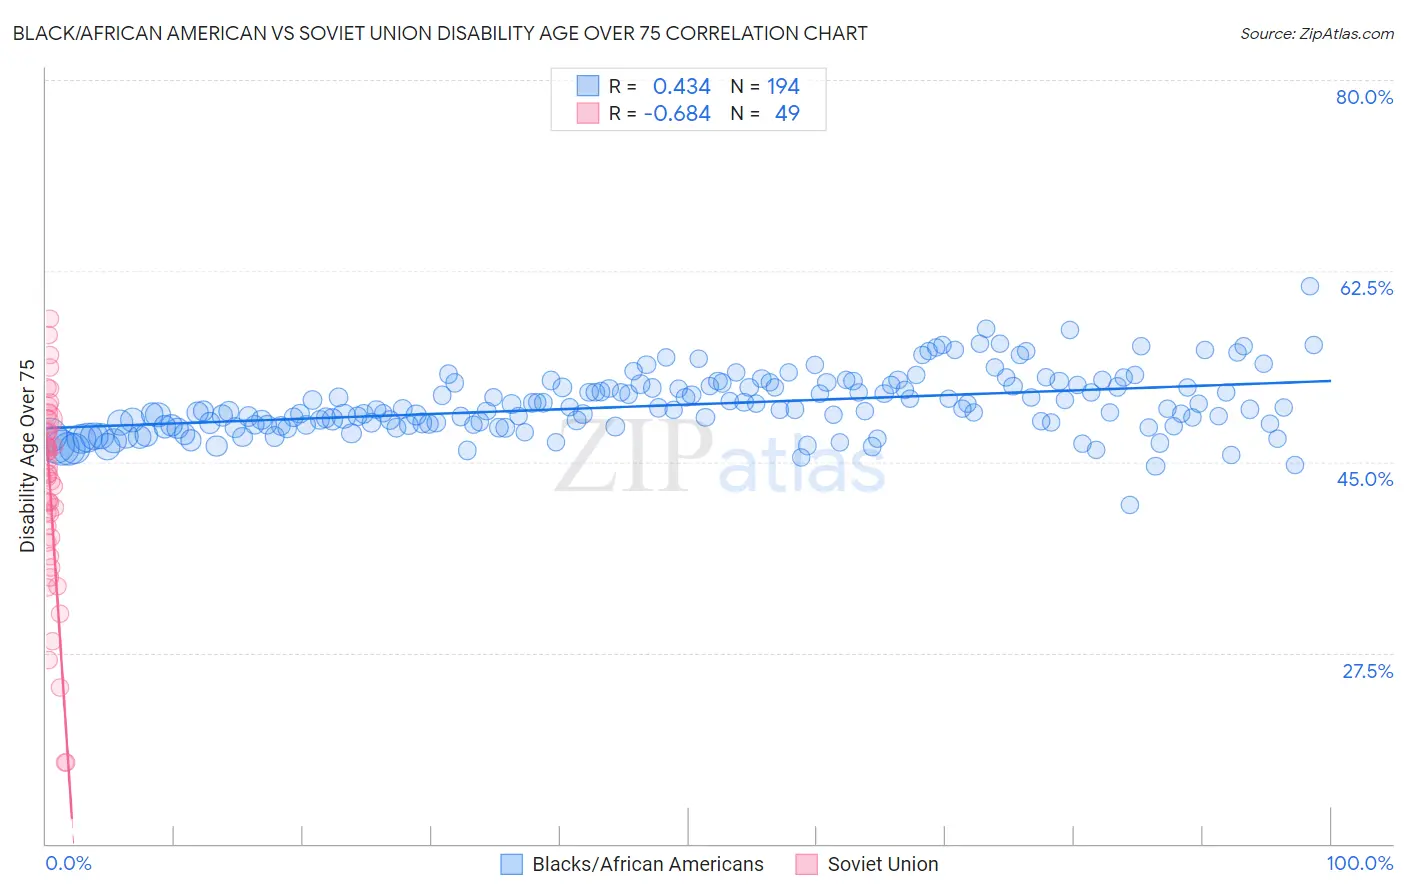
Black/African American vs Soviet Union Disability Age Over 75 Correlation Chart
The statistical analysis conducted on geographies consisting of 563,629,175 people shows a moderate positive correlation between the proportion of Blacks/African Americans and percentage of population with a disability over the age of 75 in the United States with a correlation coefficient (R) of 0.434 and weighted average of 49.5%. Similarly, the statistical analysis conducted on geographies consisting of 43,492,822 people shows a significant negative correlation between the proportion of Soviet Union and percentage of population with a disability over the age of 75 in the United States with a correlation coefficient (R) of -0.684 and weighted average of 46.2%, a difference of 7.2%.
Disability Age Over 75 Correlation Summary
| Measurement | Black/African American | Soviet Union |
| Minimum | 41.1% | 17.4% |
| Maximum | 61.0% | 58.1% |
| Range | 19.9% | 40.7% |
| Mean | 50.2% | 42.4% |
| Median | 49.8% | 43.9% |
| Interquartile 25% (IQ1) | 48.4% | 37.9% |
| Interquartile 75% (IQ3) | 52.0% | 48.3% |
| Interquartile Range (IQR) | 3.6% | 10.4% |
| Standard Deviation (Sample) | 2.8% | 9.0% |
| Standard Deviation (Population) | 2.8% | 9.0% |
Similar Demographics by Disability Age Over 75
Demographics Similar to Blacks/African Americans by Disability Age Over 75
In terms of disability age over 75, the demographic groups most similar to Blacks/African Americans are Samoan (49.5%, a difference of 0.030%), Immigrants from Latin America (49.5%, a difference of 0.080%), Belizean (49.4%, a difference of 0.14%), Bangladeshi (49.4%, a difference of 0.15%), and Guamanian/Chamorro (49.4%, a difference of 0.21%).
| Demographics | Rating | Rank | Disability Age Over 75 |
| Immigrants | Dominica | 0.1 /100 | #275 | Tragic 49.1% |
| Immigrants | Uzbekistan | 0.1 /100 | #276 | Tragic 49.2% |
| Hawaiians | 0.1 /100 | #277 | Tragic 49.2% |
| Immigrants | Laos | 0.1 /100 | #278 | Tragic 49.2% |
| Guamanians/Chamorros | 0.0 /100 | #279 | Tragic 49.4% |
| Bangladeshis | 0.0 /100 | #280 | Tragic 49.4% |
| Belizeans | 0.0 /100 | #281 | Tragic 49.4% |
| Blacks/African Americans | 0.0 /100 | #282 | Tragic 49.5% |
| Samoans | 0.0 /100 | #283 | Tragic 49.5% |
| Immigrants | Latin America | 0.0 /100 | #284 | Tragic 49.5% |
| Crow | 0.0 /100 | #285 | Tragic 49.6% |
| Immigrants | Belize | 0.0 /100 | #286 | Tragic 49.6% |
| Sioux | 0.0 /100 | #287 | Tragic 49.7% |
| Yaqui | 0.0 /100 | #288 | Tragic 49.8% |
| Osage | 0.0 /100 | #289 | Tragic 49.8% |
Demographics Similar to Soviet Union by Disability Age Over 75
In terms of disability age over 75, the demographic groups most similar to Soviet Union are Swiss (46.2%, a difference of 0.0%), New Zealander (46.2%, a difference of 0.0%), Immigrants from Latvia (46.2%, a difference of 0.020%), Argentinean (46.2%, a difference of 0.020%), and Immigrants from Western Europe (46.2%, a difference of 0.040%).
| Demographics | Rating | Rank | Disability Age Over 75 |
| Cambodians | 99.1 /100 | #73 | Exceptional 46.1% |
| Egyptians | 99.0 /100 | #74 | Exceptional 46.1% |
| Serbians | 99.0 /100 | #75 | Exceptional 46.1% |
| Slavs | 98.9 /100 | #76 | Exceptional 46.1% |
| Immigrants | Eastern Asia | 98.9 /100 | #77 | Exceptional 46.2% |
| Immigrants | Western Europe | 98.8 /100 | #78 | Exceptional 46.2% |
| Swiss | 98.8 /100 | #79 | Exceptional 46.2% |
| Soviet Union | 98.8 /100 | #80 | Exceptional 46.2% |
| New Zealanders | 98.8 /100 | #81 | Exceptional 46.2% |
| Immigrants | Latvia | 98.7 /100 | #82 | Exceptional 46.2% |
| Argentineans | 98.7 /100 | #83 | Exceptional 46.2% |
| Immigrants | Jordan | 98.7 /100 | #84 | Exceptional 46.2% |
| Immigrants | Southern Europe | 98.6 /100 | #85 | Exceptional 46.2% |
| Romanians | 98.6 /100 | #86 | Exceptional 46.2% |
| Danes | 98.6 /100 | #87 | Exceptional 46.2% |