Black/African American vs Immigrants from Mexico Disability Age Over 75
COMPARE
Black/African American
Immigrants from Mexico
Disability Age Over 75
Disability Age Over 75 Comparison
Blacks/African Americans
Immigrants from Mexico
49.5%
DISABILITY AGE OVER 75
0.0/ 100
METRIC RATING
282nd/ 347
METRIC RANK
51.1%
DISABILITY AGE OVER 75
0.0/ 100
METRIC RATING
314th/ 347
METRIC RANK
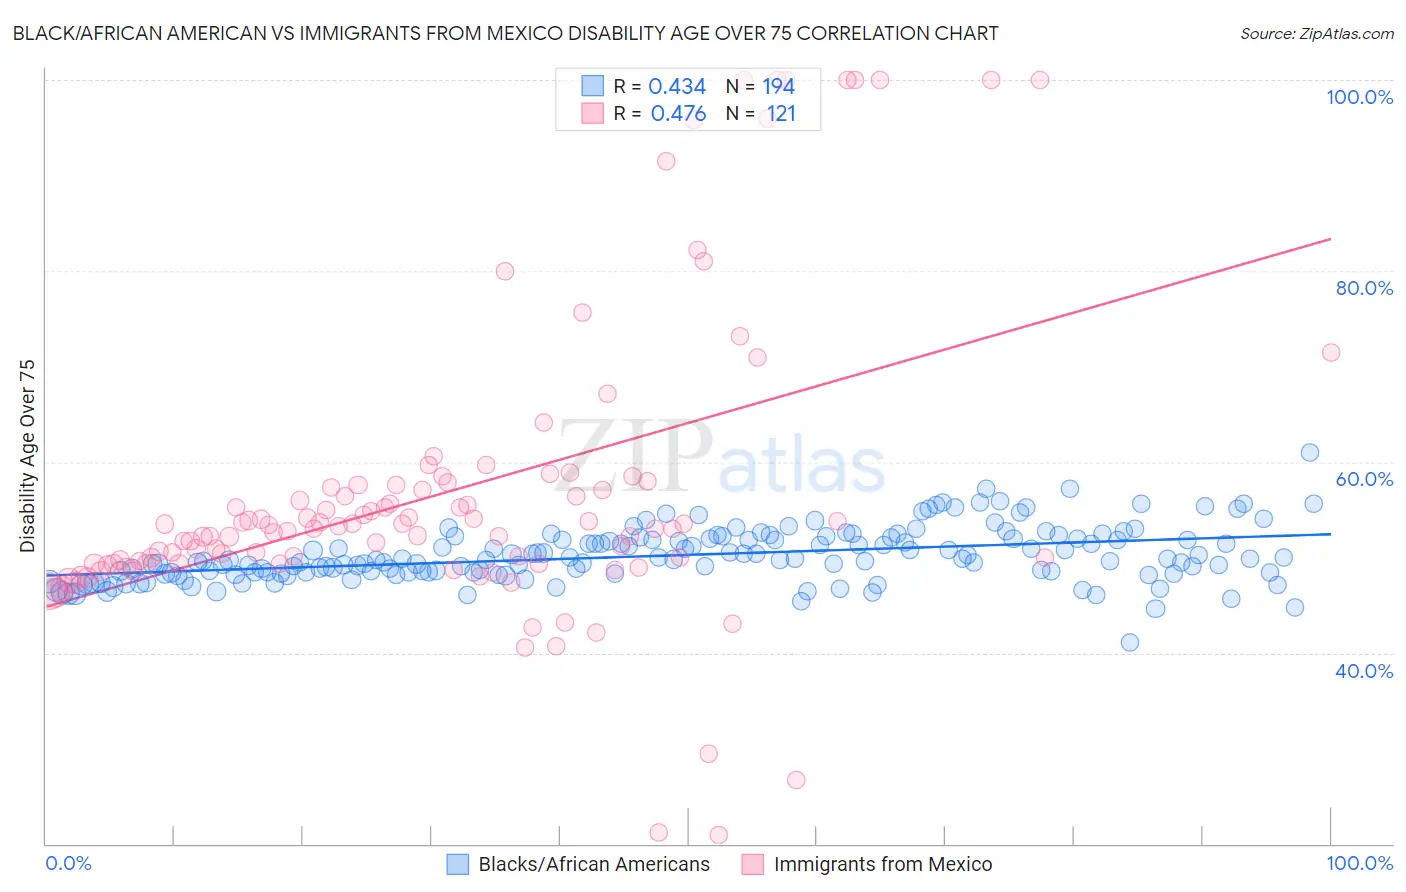
Black/African American vs Immigrants from Mexico Disability Age Over 75 Correlation Chart
The statistical analysis conducted on geographies consisting of 563,629,175 people shows a moderate positive correlation between the proportion of Blacks/African Americans and percentage of population with a disability over the age of 75 in the United States with a correlation coefficient (R) of 0.434 and weighted average of 49.5%. Similarly, the statistical analysis conducted on geographies consisting of 512,333,705 people shows a moderate positive correlation between the proportion of Immigrants from Mexico and percentage of population with a disability over the age of 75 in the United States with a correlation coefficient (R) of 0.476 and weighted average of 51.1%, a difference of 3.2%.
Disability Age Over 75 Correlation Summary
| Measurement | Black/African American | Immigrants from Mexico |
| Minimum | 41.1% | 20.9% |
| Maximum | 61.0% | 100.0% |
| Range | 19.9% | 79.1% |
| Mean | 50.2% | 56.9% |
| Median | 49.8% | 53.0% |
| Interquartile 25% (IQ1) | 48.4% | 49.3% |
| Interquartile 75% (IQ3) | 52.0% | 57.6% |
| Interquartile Range (IQR) | 3.6% | 8.2% |
| Standard Deviation (Sample) | 2.8% | 15.9% |
| Standard Deviation (Population) | 2.8% | 15.9% |
Similar Demographics by Disability Age Over 75
Demographics Similar to Blacks/African Americans by Disability Age Over 75
In terms of disability age over 75, the demographic groups most similar to Blacks/African Americans are Samoan (49.5%, a difference of 0.030%), Immigrants from Latin America (49.5%, a difference of 0.080%), Belizean (49.4%, a difference of 0.14%), Bangladeshi (49.4%, a difference of 0.15%), and Guamanian/Chamorro (49.4%, a difference of 0.21%).
| Demographics | Rating | Rank | Disability Age Over 75 |
| Immigrants | Dominica | 0.1 /100 | #275 | Tragic 49.1% |
| Immigrants | Uzbekistan | 0.1 /100 | #276 | Tragic 49.2% |
| Hawaiians | 0.1 /100 | #277 | Tragic 49.2% |
| Immigrants | Laos | 0.1 /100 | #278 | Tragic 49.2% |
| Guamanians/Chamorros | 0.0 /100 | #279 | Tragic 49.4% |
| Bangladeshis | 0.0 /100 | #280 | Tragic 49.4% |
| Belizeans | 0.0 /100 | #281 | Tragic 49.4% |
| Blacks/African Americans | 0.0 /100 | #282 | Tragic 49.5% |
| Samoans | 0.0 /100 | #283 | Tragic 49.5% |
| Immigrants | Latin America | 0.0 /100 | #284 | Tragic 49.5% |
| Crow | 0.0 /100 | #285 | Tragic 49.6% |
| Immigrants | Belize | 0.0 /100 | #286 | Tragic 49.6% |
| Sioux | 0.0 /100 | #287 | Tragic 49.7% |
| Yaqui | 0.0 /100 | #288 | Tragic 49.8% |
| Osage | 0.0 /100 | #289 | Tragic 49.8% |
Demographics Similar to Immigrants from Mexico by Disability Age Over 75
In terms of disability age over 75, the demographic groups most similar to Immigrants from Mexico are Mexican (51.1%, a difference of 0.050%), Chickasaw (51.2%, a difference of 0.19%), Immigrants from the Azores (50.9%, a difference of 0.37%), Yakama (51.3%, a difference of 0.37%), and Cheyenne (50.9%, a difference of 0.42%).
| Demographics | Rating | Rank | Disability Age Over 75 |
| Immigrants | Fiji | 0.0 /100 | #307 | Tragic 50.6% |
| Hispanics or Latinos | 0.0 /100 | #308 | Tragic 50.6% |
| Aleuts | 0.0 /100 | #309 | Tragic 50.6% |
| Tlingit-Haida | 0.0 /100 | #310 | Tragic 50.6% |
| Cajuns | 0.0 /100 | #311 | Tragic 50.7% |
| Cheyenne | 0.0 /100 | #312 | Tragic 50.9% |
| Immigrants | Azores | 0.0 /100 | #313 | Tragic 50.9% |
| Immigrants | Mexico | 0.0 /100 | #314 | Tragic 51.1% |
| Mexicans | 0.0 /100 | #315 | Tragic 51.1% |
| Chickasaw | 0.0 /100 | #316 | Tragic 51.2% |
| Yakama | 0.0 /100 | #317 | Tragic 51.3% |
| Seminole | 0.0 /100 | #318 | Tragic 51.5% |
| Creek | 0.0 /100 | #319 | Tragic 51.5% |
| Paiute | 0.0 /100 | #320 | Tragic 51.5% |
| Dutch West Indians | 0.0 /100 | #321 | Tragic 51.5% |