Black/African American vs Immigrants from St. Vincent and the Grenadines High School Diploma
COMPARE
Black/African American
Immigrants from St. Vincent and the Grenadines
High School Diploma
High School Diploma Comparison
Blacks/African Americans
Immigrants from St. Vincent and the Grenadines
87.0%
HIGH SCHOOL DIPLOMA
0.2/ 100
METRIC RATING
267th/ 347
METRIC RANK
86.2%
HIGH SCHOOL DIPLOMA
0.0/ 100
METRIC RATING
286th/ 347
METRIC RANK
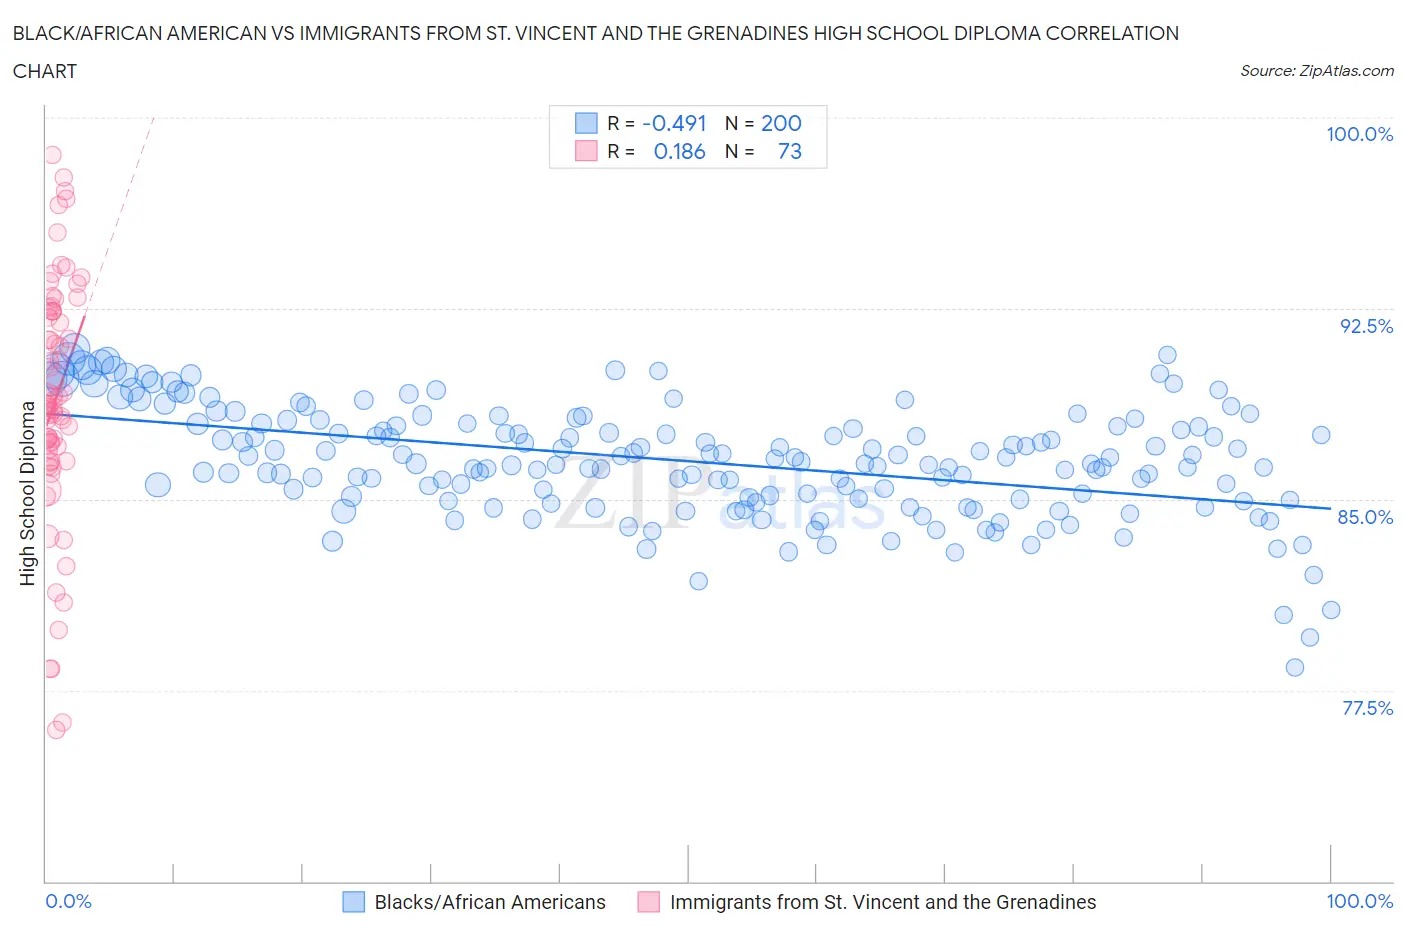
Black/African American vs Immigrants from St. Vincent and the Grenadines High School Diploma Correlation Chart
The statistical analysis conducted on geographies consisting of 566,048,038 people shows a moderate negative correlation between the proportion of Blacks/African Americans and percentage of population with at least high school diploma education in the United States with a correlation coefficient (R) of -0.491 and weighted average of 87.0%. Similarly, the statistical analysis conducted on geographies consisting of 56,191,418 people shows a poor positive correlation between the proportion of Immigrants from St. Vincent and the Grenadines and percentage of population with at least high school diploma education in the United States with a correlation coefficient (R) of 0.186 and weighted average of 86.2%, a difference of 0.99%.
High School Diploma Correlation Summary
| Measurement | Black/African American | Immigrants from St. Vincent and the Grenadines |
| Minimum | 78.4% | 76.0% |
| Maximum | 90.9% | 98.5% |
| Range | 12.5% | 22.6% |
| Mean | 86.5% | 88.9% |
| Median | 86.4% | 88.7% |
| Interquartile 25% (IQ1) | 85.0% | 86.7% |
| Interquartile 75% (IQ3) | 88.0% | 92.4% |
| Interquartile Range (IQR) | 3.0% | 5.7% |
| Standard Deviation (Sample) | 2.2% | 4.8% |
| Standard Deviation (Population) | 2.2% | 4.8% |
Demographics Similar to Blacks/African Americans and Immigrants from St. Vincent and the Grenadines by High School Diploma
In terms of high school diploma, the demographic groups most similar to Blacks/African Americans are Immigrants from Congo (87.0%, a difference of 0.010%), Pennsylvania German (87.0%, a difference of 0.030%), Sri Lankan (87.0%, a difference of 0.040%), Malaysian (87.0%, a difference of 0.060%), and West Indian (86.9%, a difference of 0.12%). Similarly, the demographic groups most similar to Immigrants from St. Vincent and the Grenadines are Immigrants from West Indies (86.2%, a difference of 0.020%), Paiute (86.4%, a difference of 0.22%), Immigrants from Barbados (86.4%, a difference of 0.27%), Dutch West Indian (86.5%, a difference of 0.32%), and Indonesian (86.5%, a difference of 0.37%).
| Demographics | Rating | Rank | High School Diploma |
| Immigrants | Congo | 0.2 /100 | #266 | Tragic 87.0% |
| Blacks/African Americans | 0.2 /100 | #267 | Tragic 87.0% |
| Pennsylvania Germans | 0.2 /100 | #268 | Tragic 87.0% |
| Sri Lankans | 0.2 /100 | #269 | Tragic 87.0% |
| Malaysians | 0.2 /100 | #270 | Tragic 87.0% |
| West Indians | 0.1 /100 | #271 | Tragic 86.9% |
| Trinidadians and Tobagonians | 0.1 /100 | #272 | Tragic 86.9% |
| Immigrants | Jamaica | 0.1 /100 | #273 | Tragic 86.9% |
| Bangladeshis | 0.1 /100 | #274 | Tragic 86.9% |
| Immigrants | Trinidad and Tobago | 0.1 /100 | #275 | Tragic 86.8% |
| Immigrants | Burma/Myanmar | 0.1 /100 | #276 | Tragic 86.7% |
| Barbadians | 0.1 /100 | #277 | Tragic 86.7% |
| Hopi | 0.1 /100 | #278 | Tragic 86.6% |
| Immigrants | Laos | 0.0 /100 | #279 | Tragic 86.6% |
| Pueblo | 0.0 /100 | #280 | Tragic 86.5% |
| Indonesians | 0.0 /100 | #281 | Tragic 86.5% |
| Dutch West Indians | 0.0 /100 | #282 | Tragic 86.5% |
| Immigrants | Barbados | 0.0 /100 | #283 | Tragic 86.4% |
| Paiute | 0.0 /100 | #284 | Tragic 86.4% |
| Immigrants | West Indies | 0.0 /100 | #285 | Tragic 86.2% |
| Immigrants | St. Vincent and the Grenadines | 0.0 /100 | #286 | Tragic 86.2% |