Black/African American vs Asian Disability Age Over 75
COMPARE
Black/African American
Asian
Disability Age Over 75
Disability Age Over 75 Comparison
Blacks/African Americans
Asians
49.5%
DISABILITY AGE OVER 75
0.0/ 100
METRIC RATING
282nd/ 347
METRIC RANK
46.9%
DISABILITY AGE OVER 75
81.6/ 100
METRIC RATING
148th/ 347
METRIC RANK
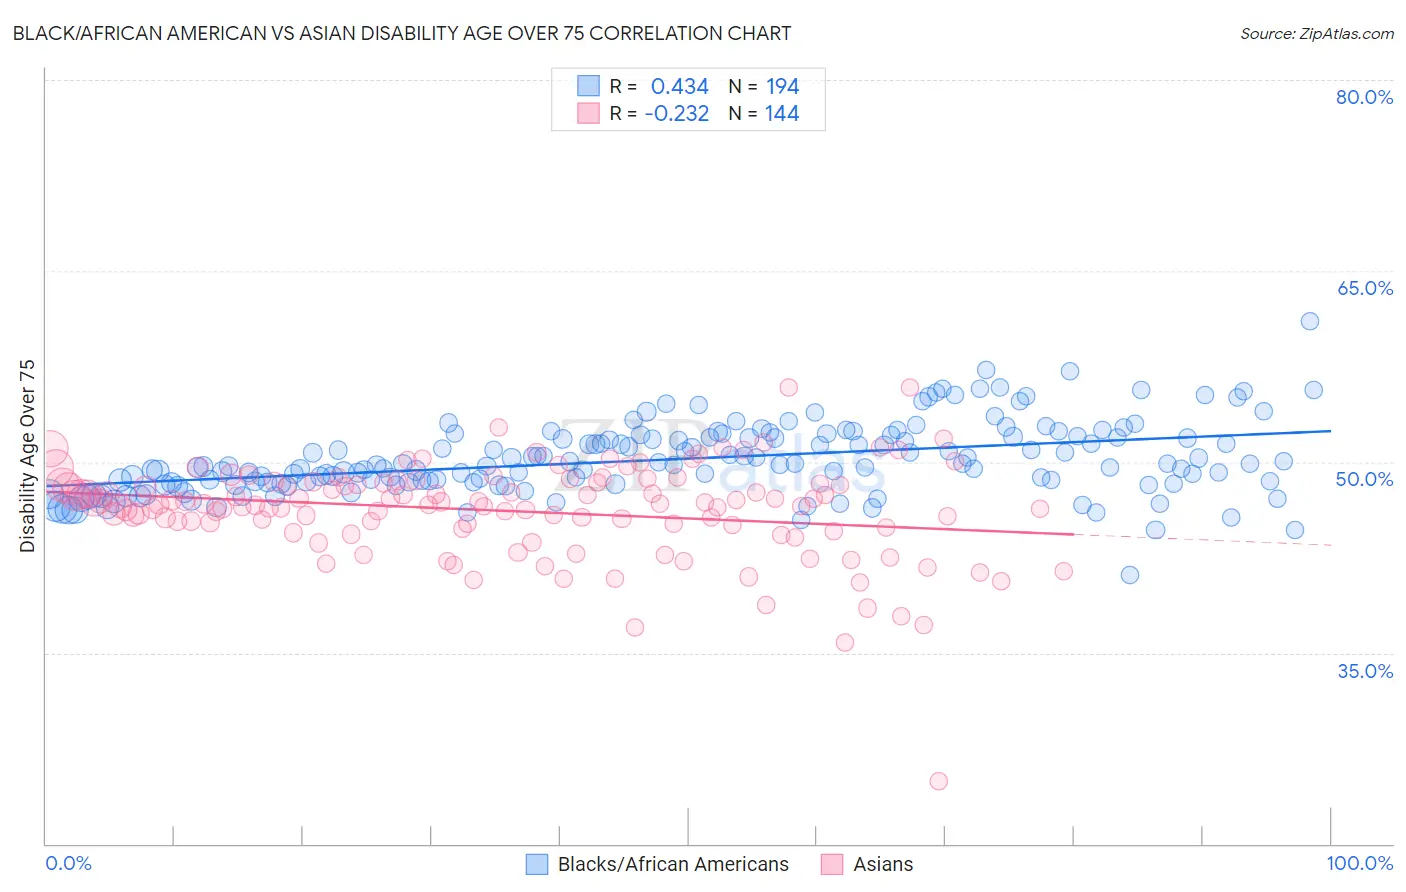
Black/African American vs Asian Disability Age Over 75 Correlation Chart
The statistical analysis conducted on geographies consisting of 563,629,175 people shows a moderate positive correlation between the proportion of Blacks/African Americans and percentage of population with a disability over the age of 75 in the United States with a correlation coefficient (R) of 0.434 and weighted average of 49.5%. Similarly, the statistical analysis conducted on geographies consisting of 549,007,730 people shows a weak negative correlation between the proportion of Asians and percentage of population with a disability over the age of 75 in the United States with a correlation coefficient (R) of -0.232 and weighted average of 46.9%, a difference of 5.4%.
Disability Age Over 75 Correlation Summary
| Measurement | Black/African American | Asian |
| Minimum | 41.1% | 24.9% |
| Maximum | 61.0% | 55.8% |
| Range | 19.9% | 30.9% |
| Mean | 50.2% | 46.1% |
| Median | 49.8% | 46.6% |
| Interquartile 25% (IQ1) | 48.4% | 44.8% |
| Interquartile 75% (IQ3) | 52.0% | 48.3% |
| Interquartile Range (IQR) | 3.6% | 3.5% |
| Standard Deviation (Sample) | 2.8% | 3.8% |
| Standard Deviation (Population) | 2.8% | 3.8% |
Similar Demographics by Disability Age Over 75
Demographics Similar to Blacks/African Americans by Disability Age Over 75
In terms of disability age over 75, the demographic groups most similar to Blacks/African Americans are Samoan (49.5%, a difference of 0.030%), Immigrants from Latin America (49.5%, a difference of 0.080%), Belizean (49.4%, a difference of 0.14%), Bangladeshi (49.4%, a difference of 0.15%), and Guamanian/Chamorro (49.4%, a difference of 0.21%).
| Demographics | Rating | Rank | Disability Age Over 75 |
| Immigrants | Dominica | 0.1 /100 | #275 | Tragic 49.1% |
| Immigrants | Uzbekistan | 0.1 /100 | #276 | Tragic 49.2% |
| Hawaiians | 0.1 /100 | #277 | Tragic 49.2% |
| Immigrants | Laos | 0.1 /100 | #278 | Tragic 49.2% |
| Guamanians/Chamorros | 0.0 /100 | #279 | Tragic 49.4% |
| Bangladeshis | 0.0 /100 | #280 | Tragic 49.4% |
| Belizeans | 0.0 /100 | #281 | Tragic 49.4% |
| Blacks/African Americans | 0.0 /100 | #282 | Tragic 49.5% |
| Samoans | 0.0 /100 | #283 | Tragic 49.5% |
| Immigrants | Latin America | 0.0 /100 | #284 | Tragic 49.5% |
| Crow | 0.0 /100 | #285 | Tragic 49.6% |
| Immigrants | Belize | 0.0 /100 | #286 | Tragic 49.6% |
| Sioux | 0.0 /100 | #287 | Tragic 49.7% |
| Yaqui | 0.0 /100 | #288 | Tragic 49.8% |
| Osage | 0.0 /100 | #289 | Tragic 49.8% |
Demographics Similar to Asians by Disability Age Over 75
In terms of disability age over 75, the demographic groups most similar to Asians are Welsh (47.0%, a difference of 0.010%), Immigrants from Russia (47.0%, a difference of 0.080%), French Canadian (47.0%, a difference of 0.090%), Immigrants from Peru (46.9%, a difference of 0.10%), and Guyanese (46.9%, a difference of 0.11%).
| Demographics | Rating | Rank | Disability Age Over 75 |
| Lebanese | 87.0 /100 | #141 | Excellent 46.8% |
| Peruvians | 86.5 /100 | #142 | Excellent 46.8% |
| Bermudans | 85.6 /100 | #143 | Excellent 46.9% |
| Venezuelans | 85.0 /100 | #144 | Excellent 46.9% |
| Costa Ricans | 84.5 /100 | #145 | Excellent 46.9% |
| Guyanese | 84.3 /100 | #146 | Excellent 46.9% |
| Immigrants | Peru | 84.1 /100 | #147 | Excellent 46.9% |
| Asians | 81.6 /100 | #148 | Excellent 46.9% |
| Welsh | 81.3 /100 | #149 | Excellent 47.0% |
| Immigrants | Russia | 79.3 /100 | #150 | Good 47.0% |
| French Canadians | 79.0 /100 | #151 | Good 47.0% |
| Immigrants | Asia | 76.5 /100 | #152 | Good 47.0% |
| Immigrants | Zaire | 74.8 /100 | #153 | Good 47.1% |
| Immigrants | Belarus | 74.8 /100 | #154 | Good 47.1% |
| Immigrants | Iran | 74.7 /100 | #155 | Good 47.1% |