Black/African American vs Korean Disability Age Over 75
COMPARE
Black/African American
Korean
Disability Age Over 75
Disability Age Over 75 Comparison
Blacks/African Americans
Koreans
49.5%
DISABILITY AGE OVER 75
0.0/ 100
METRIC RATING
282nd/ 347
METRIC RANK
48.6%
DISABILITY AGE OVER 75
0.8/ 100
METRIC RATING
251st/ 347
METRIC RANK
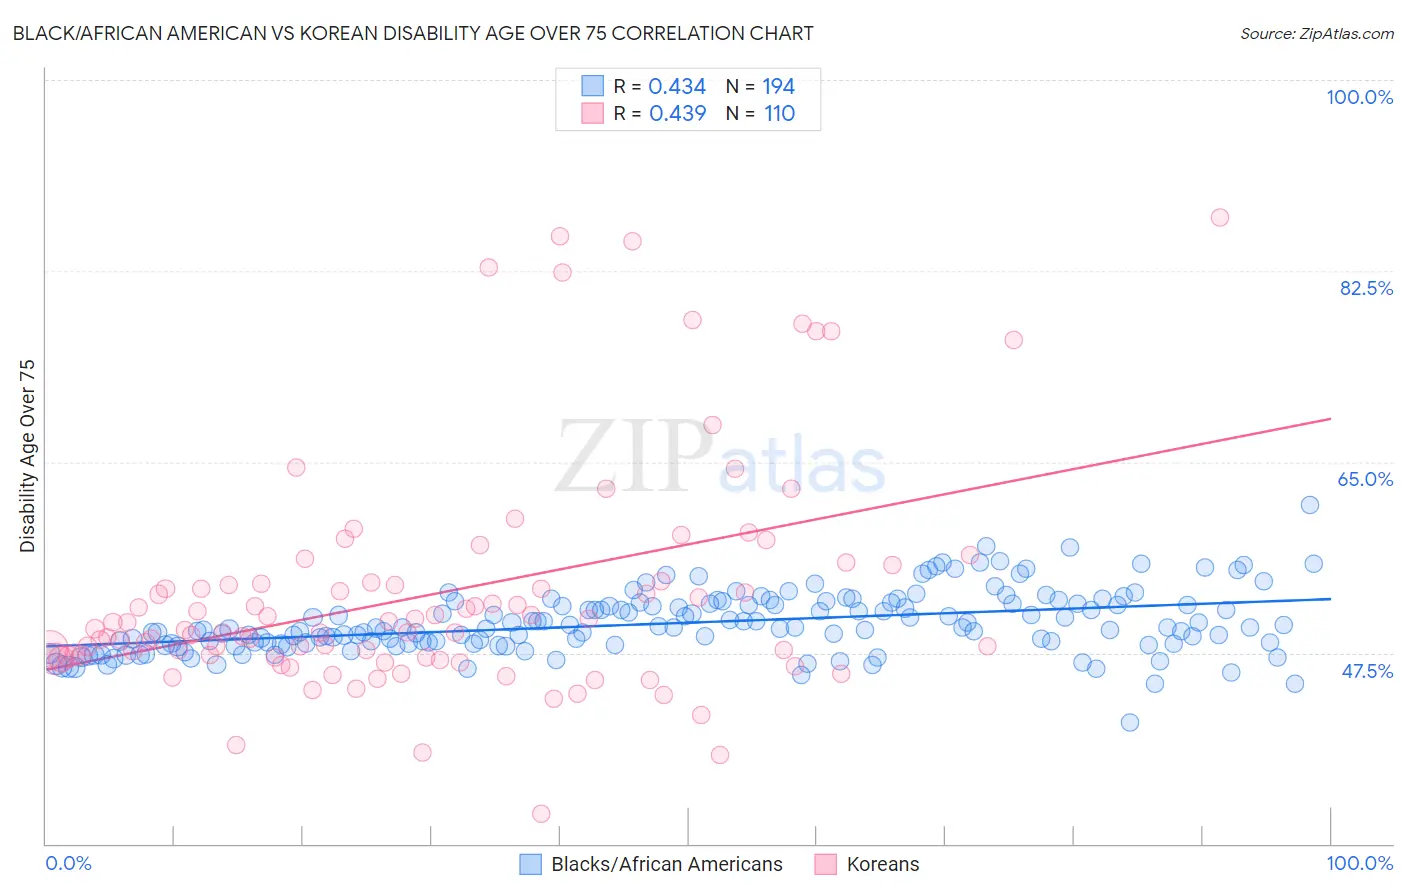
Black/African American vs Korean Disability Age Over 75 Correlation Chart
The statistical analysis conducted on geographies consisting of 563,629,175 people shows a moderate positive correlation between the proportion of Blacks/African Americans and percentage of population with a disability over the age of 75 in the United States with a correlation coefficient (R) of 0.434 and weighted average of 49.5%. Similarly, the statistical analysis conducted on geographies consisting of 509,359,043 people shows a moderate positive correlation between the proportion of Koreans and percentage of population with a disability over the age of 75 in the United States with a correlation coefficient (R) of 0.439 and weighted average of 48.6%, a difference of 1.8%.
Disability Age Over 75 Correlation Summary
| Measurement | Black/African American | Korean |
| Minimum | 41.1% | 32.7% |
| Maximum | 61.0% | 87.4% |
| Range | 19.9% | 54.7% |
| Mean | 50.2% | 52.9% |
| Median | 49.8% | 49.6% |
| Interquartile 25% (IQ1) | 48.4% | 47.1% |
| Interquartile 75% (IQ3) | 52.0% | 53.9% |
| Interquartile Range (IQR) | 3.6% | 6.9% |
| Standard Deviation (Sample) | 2.8% | 10.5% |
| Standard Deviation (Population) | 2.8% | 10.4% |
Similar Demographics by Disability Age Over 75
Demographics Similar to Blacks/African Americans by Disability Age Over 75
In terms of disability age over 75, the demographic groups most similar to Blacks/African Americans are Samoan (49.5%, a difference of 0.030%), Immigrants from Latin America (49.5%, a difference of 0.080%), Belizean (49.4%, a difference of 0.14%), Bangladeshi (49.4%, a difference of 0.15%), and Guamanian/Chamorro (49.4%, a difference of 0.21%).
| Demographics | Rating | Rank | Disability Age Over 75 |
| Immigrants | Dominica | 0.1 /100 | #275 | Tragic 49.1% |
| Immigrants | Uzbekistan | 0.1 /100 | #276 | Tragic 49.2% |
| Hawaiians | 0.1 /100 | #277 | Tragic 49.2% |
| Immigrants | Laos | 0.1 /100 | #278 | Tragic 49.2% |
| Guamanians/Chamorros | 0.0 /100 | #279 | Tragic 49.4% |
| Bangladeshis | 0.0 /100 | #280 | Tragic 49.4% |
| Belizeans | 0.0 /100 | #281 | Tragic 49.4% |
| Blacks/African Americans | 0.0 /100 | #282 | Tragic 49.5% |
| Samoans | 0.0 /100 | #283 | Tragic 49.5% |
| Immigrants | Latin America | 0.0 /100 | #284 | Tragic 49.5% |
| Crow | 0.0 /100 | #285 | Tragic 49.6% |
| Immigrants | Belize | 0.0 /100 | #286 | Tragic 49.6% |
| Sioux | 0.0 /100 | #287 | Tragic 49.7% |
| Yaqui | 0.0 /100 | #288 | Tragic 49.8% |
| Osage | 0.0 /100 | #289 | Tragic 49.8% |
Demographics Similar to Koreans by Disability Age Over 75
In terms of disability age over 75, the demographic groups most similar to Koreans are West Indian (48.6%, a difference of 0.020%), Iraqi (48.6%, a difference of 0.10%), Immigrants from South Eastern Asia (48.7%, a difference of 0.10%), British West Indian (48.7%, a difference of 0.15%), and Immigrants from Vietnam (48.7%, a difference of 0.18%).
| Demographics | Rating | Rank | Disability Age Over 75 |
| Afghans | 1.8 /100 | #244 | Tragic 48.4% |
| Americans | 1.7 /100 | #245 | Tragic 48.4% |
| Chippewa | 1.6 /100 | #246 | Tragic 48.4% |
| Iroquois | 1.6 /100 | #247 | Tragic 48.4% |
| Sri Lankans | 1.4 /100 | #248 | Tragic 48.5% |
| Iraqis | 1.0 /100 | #249 | Tragic 48.6% |
| West Indians | 0.8 /100 | #250 | Tragic 48.6% |
| Koreans | 0.8 /100 | #251 | Tragic 48.6% |
| Immigrants | South Eastern Asia | 0.7 /100 | #252 | Tragic 48.7% |
| British West Indians | 0.6 /100 | #253 | Tragic 48.7% |
| Immigrants | Vietnam | 0.6 /100 | #254 | Tragic 48.7% |
| Chinese | 0.5 /100 | #255 | Tragic 48.7% |
| Immigrants | Congo | 0.5 /100 | #256 | Tragic 48.7% |
| Blackfeet | 0.5 /100 | #257 | Tragic 48.8% |
| Immigrants | Philippines | 0.4 /100 | #258 | Tragic 48.8% |