Zimbabwean vs Immigrants from St. Vincent and the Grenadines Disability Age Over 75
COMPARE
Zimbabwean
Immigrants from St. Vincent and the Grenadines
Disability Age Over 75
Disability Age Over 75 Comparison
Zimbabweans
Immigrants from St. Vincent and the Grenadines
48.1%
DISABILITY AGE OVER 75
6.4/ 100
METRIC RATING
227th/ 347
METRIC RANK
48.2%
DISABILITY AGE OVER 75
3.2/ 100
METRIC RATING
237th/ 347
METRIC RANK
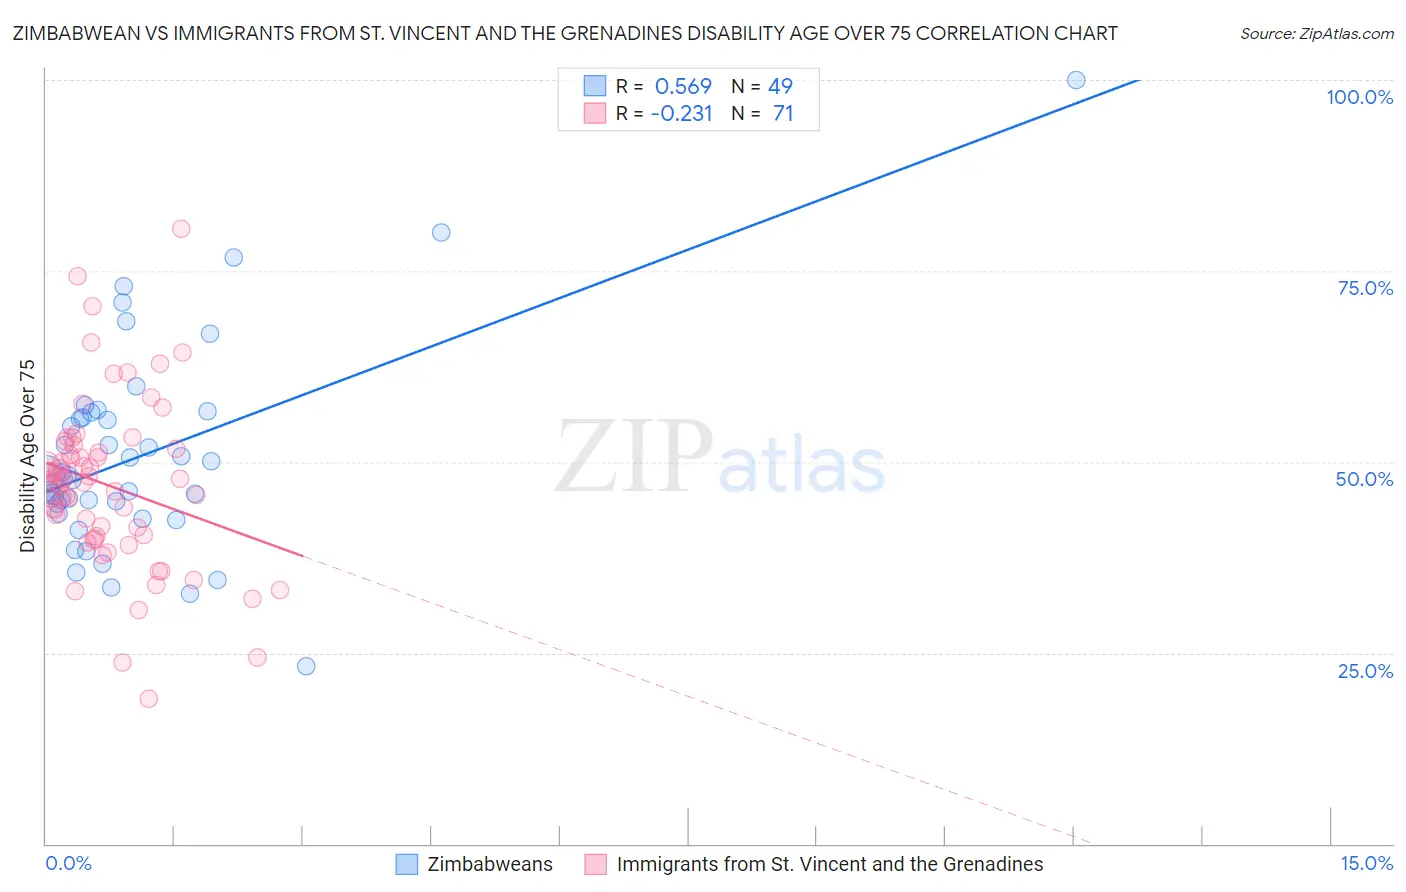
Zimbabwean vs Immigrants from St. Vincent and the Grenadines Disability Age Over 75 Correlation Chart
The statistical analysis conducted on geographies consisting of 69,112,406 people shows a substantial positive correlation between the proportion of Zimbabweans and percentage of population with a disability over the age of 75 in the United States with a correlation coefficient (R) of 0.569 and weighted average of 48.1%. Similarly, the statistical analysis conducted on geographies consisting of 56,132,853 people shows a weak negative correlation between the proportion of Immigrants from St. Vincent and the Grenadines and percentage of population with a disability over the age of 75 in the United States with a correlation coefficient (R) of -0.231 and weighted average of 48.2%, a difference of 0.41%.
Disability Age Over 75 Correlation Summary
| Measurement | Zimbabwean | Immigrants from St. Vincent and the Grenadines |
| Minimum | 23.2% | 19.0% |
| Maximum | 100.0% | 80.4% |
| Range | 76.8% | 61.5% |
| Mean | 50.8% | 47.0% |
| Median | 48.2% | 47.5% |
| Interquartile 25% (IQ1) | 43.9% | 40.3% |
| Interquartile 75% (IQ3) | 56.1% | 51.8% |
| Interquartile Range (IQR) | 12.3% | 11.4% |
| Standard Deviation (Sample) | 13.5% | 10.9% |
| Standard Deviation (Population) | 13.4% | 10.8% |
Demographics Similar to Zimbabweans and Immigrants from St. Vincent and the Grenadines by Disability Age Over 75
In terms of disability age over 75, the demographic groups most similar to Zimbabweans are Spanish (48.0%, a difference of 0.010%), Nonimmigrants (48.0%, a difference of 0.010%), Liberian (48.0%, a difference of 0.020%), Immigrants from Bangladesh (48.0%, a difference of 0.030%), and Barbadian (48.0%, a difference of 0.040%). Similarly, the demographic groups most similar to Immigrants from St. Vincent and the Grenadines are Immigrants from Nicaragua (48.2%, a difference of 0.0%), Nicaraguan (48.3%, a difference of 0.030%), Immigrants from Thailand (48.3%, a difference of 0.080%), Subsaharan African (48.2%, a difference of 0.10%), and Hmong (48.2%, a difference of 0.10%).
| Demographics | Rating | Rank | Disability Age Over 75 |
| Barbadians | 6.8 /100 | #222 | Tragic 48.0% |
| Immigrants | Bangladesh | 6.8 /100 | #223 | Tragic 48.0% |
| Liberians | 6.7 /100 | #224 | Tragic 48.0% |
| Spanish | 6.5 /100 | #225 | Tragic 48.0% |
| Immigrants | Nonimmigrants | 6.5 /100 | #226 | Tragic 48.0% |
| Zimbabweans | 6.4 /100 | #227 | Tragic 48.1% |
| Immigrants | Liberia | 5.9 /100 | #228 | Tragic 48.1% |
| Spaniards | 5.7 /100 | #229 | Tragic 48.1% |
| Taiwanese | 4.4 /100 | #230 | Tragic 48.2% |
| Immigrants | Immigrants | 4.3 /100 | #231 | Tragic 48.2% |
| Indonesians | 4.2 /100 | #232 | Tragic 48.2% |
| Cree | 4.2 /100 | #233 | Tragic 48.2% |
| Sub-Saharan Africans | 3.8 /100 | #234 | Tragic 48.2% |
| Hmong | 3.8 /100 | #235 | Tragic 48.2% |
| Immigrants | Nicaragua | 3.2 /100 | #236 | Tragic 48.2% |
| Immigrants | St. Vincent and the Grenadines | 3.2 /100 | #237 | Tragic 48.2% |
| Nicaraguans | 3.0 /100 | #238 | Tragic 48.3% |
| Immigrants | Thailand | 2.8 /100 | #239 | Tragic 48.3% |
| Tongans | 2.3 /100 | #240 | Tragic 48.3% |
| Native Hawaiians | 2.2 /100 | #241 | Tragic 48.3% |
| French American Indians | 2.2 /100 | #242 | Tragic 48.3% |