Black/African American vs Immigrants from St. Vincent and the Grenadines Family Poverty
COMPARE
Black/African American
Immigrants from St. Vincent and the Grenadines
Family Poverty
Family Poverty Comparison
Blacks/African Americans
Immigrants from St. Vincent and the Grenadines
13.3%
FAMILY POVERTY
0.0/ 100
METRIC RATING
329th/ 347
METRIC RANK
11.6%
FAMILY POVERTY
0.0/ 100
METRIC RATING
294th/ 347
METRIC RANK
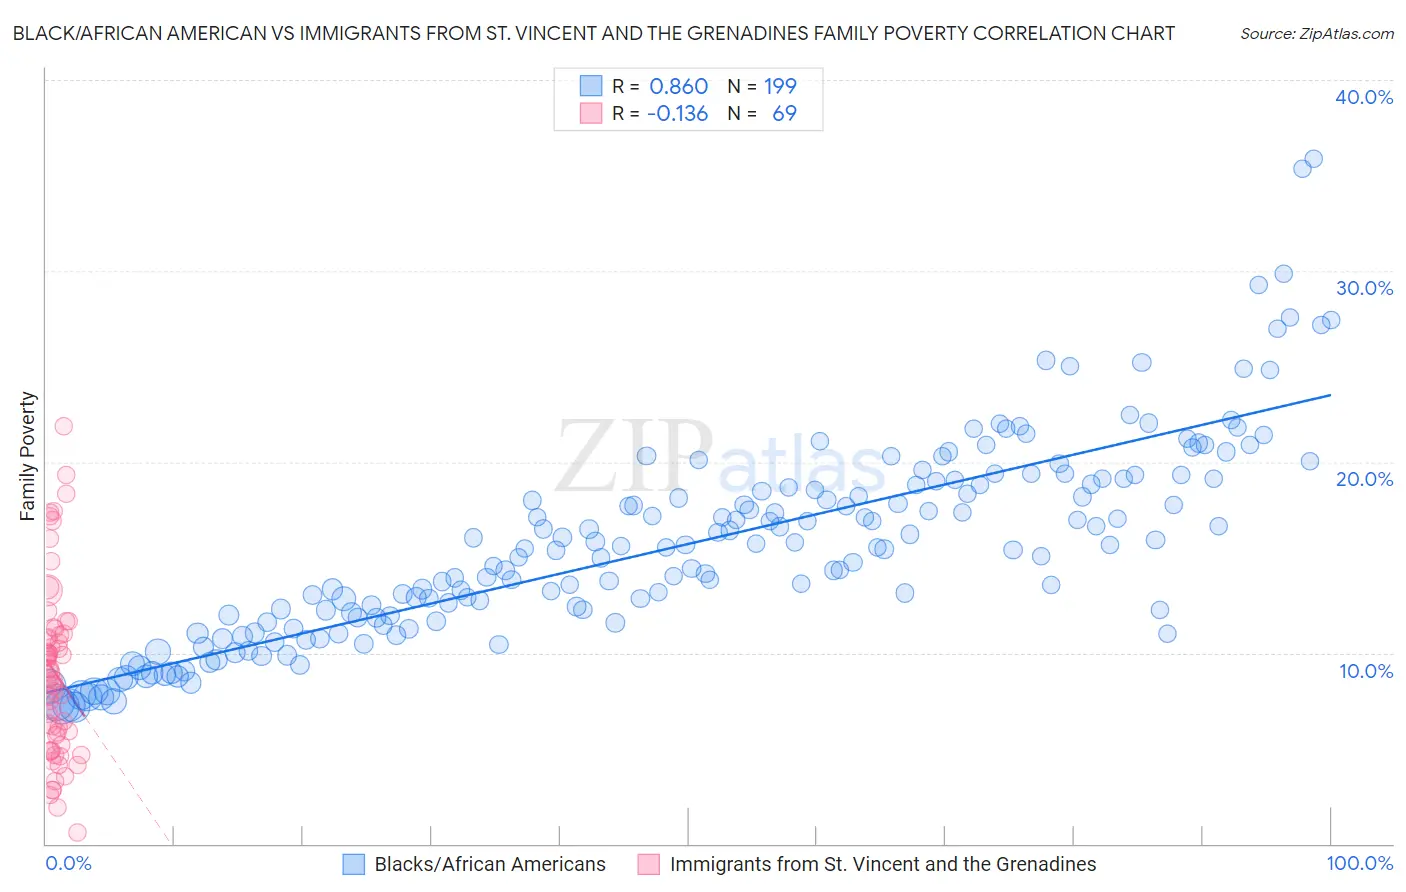
Black/African American vs Immigrants from St. Vincent and the Grenadines Family Poverty Correlation Chart
The statistical analysis conducted on geographies consisting of 562,121,260 people shows a very strong positive correlation between the proportion of Blacks/African Americans and poverty level among families in the United States with a correlation coefficient (R) of 0.860 and weighted average of 13.3%. Similarly, the statistical analysis conducted on geographies consisting of 56,084,052 people shows a poor negative correlation between the proportion of Immigrants from St. Vincent and the Grenadines and poverty level among families in the United States with a correlation coefficient (R) of -0.136 and weighted average of 11.6%, a difference of 14.9%.
Family Poverty Correlation Summary
| Measurement | Black/African American | Immigrants from St. Vincent and the Grenadines |
| Minimum | 7.2% | 0.61% |
| Maximum | 35.9% | 21.9% |
| Range | 28.7% | 21.2% |
| Mean | 15.7% | 9.0% |
| Median | 15.5% | 8.6% |
| Interquartile 25% (IQ1) | 11.8% | 5.4% |
| Interquartile 75% (IQ3) | 18.8% | 11.0% |
| Interquartile Range (IQR) | 7.0% | 5.6% |
| Standard Deviation (Sample) | 5.2% | 4.5% |
| Standard Deviation (Population) | 5.2% | 4.5% |
Similar Demographics by Family Poverty
Demographics Similar to Blacks/African Americans by Family Poverty
In terms of family poverty, the demographic groups most similar to Blacks/African Americans are Central American Indian (13.3%, a difference of 0.17%), Yakama (13.1%, a difference of 1.8%), Colville (13.0%, a difference of 2.5%), Paiute (13.0%, a difference of 2.6%), and Immigrants from Dominica (12.7%, a difference of 4.6%).
| Demographics | Rating | Rank | Family Poverty |
| Immigrants | Honduras | 0.0 /100 | #322 | Tragic 12.7% |
| Menominee | 0.0 /100 | #323 | Tragic 12.7% |
| Immigrants | Dominica | 0.0 /100 | #324 | Tragic 12.7% |
| Paiute | 0.0 /100 | #325 | Tragic 13.0% |
| Colville | 0.0 /100 | #326 | Tragic 13.0% |
| Yakama | 0.0 /100 | #327 | Tragic 13.1% |
| Central American Indians | 0.0 /100 | #328 | Tragic 13.3% |
| Blacks/African Americans | 0.0 /100 | #329 | Tragic 13.3% |
| Natives/Alaskans | 0.0 /100 | #330 | Tragic 14.3% |
| Cheyenne | 0.0 /100 | #331 | Tragic 14.3% |
| Dominicans | 0.0 /100 | #332 | Tragic 14.3% |
| Immigrants | Dominican Republic | 0.0 /100 | #333 | Tragic 14.4% |
| Houma | 0.0 /100 | #334 | Tragic 14.6% |
| Apache | 0.0 /100 | #335 | Tragic 14.7% |
| Sioux | 0.0 /100 | #336 | Tragic 15.9% |
Demographics Similar to Immigrants from St. Vincent and the Grenadines by Family Poverty
In terms of family poverty, the demographic groups most similar to Immigrants from St. Vincent and the Grenadines are Immigrants from Cabo Verde (11.6%, a difference of 0.080%), Immigrants from Haiti (11.6%, a difference of 0.12%), Choctaw (11.6%, a difference of 0.17%), Creek (11.7%, a difference of 0.41%), and Immigrants from Somalia (11.5%, a difference of 0.51%).
| Demographics | Rating | Rank | Family Poverty |
| Vietnamese | 0.0 /100 | #287 | Tragic 11.5% |
| Immigrants | Belize | 0.0 /100 | #288 | Tragic 11.5% |
| Immigrants | Barbados | 0.0 /100 | #289 | Tragic 11.5% |
| West Indians | 0.0 /100 | #290 | Tragic 11.5% |
| Haitians | 0.0 /100 | #291 | Tragic 11.5% |
| Immigrants | Somalia | 0.0 /100 | #292 | Tragic 11.5% |
| Immigrants | Cabo Verde | 0.0 /100 | #293 | Tragic 11.6% |
| Immigrants | St. Vincent and the Grenadines | 0.0 /100 | #294 | Tragic 11.6% |
| Immigrants | Haiti | 0.0 /100 | #295 | Tragic 11.6% |
| Choctaw | 0.0 /100 | #296 | Tragic 11.6% |
| Creek | 0.0 /100 | #297 | Tragic 11.7% |
| Immigrants | Senegal | 0.0 /100 | #298 | Tragic 11.7% |
| Dutch West Indians | 0.0 /100 | #299 | Tragic 11.7% |
| Immigrants | Bangladesh | 0.0 /100 | #300 | Tragic 11.7% |
| Bahamians | 0.0 /100 | #301 | Tragic 11.7% |