Blackfeet vs Yaqui Disability Age 5 to 17
COMPARE
Blackfeet
Yaqui
Disability Age 5 to 17
Disability Age 5 to 17 Comparison
Blackfeet
Yaqui
6.6%
DISABILITY AGE 5 TO 17
0.0/ 100
METRIC RATING
329th/ 347
METRIC RANK
6.2%
DISABILITY AGE 5 TO 17
0.0/ 100
METRIC RATING
289th/ 347
METRIC RANK
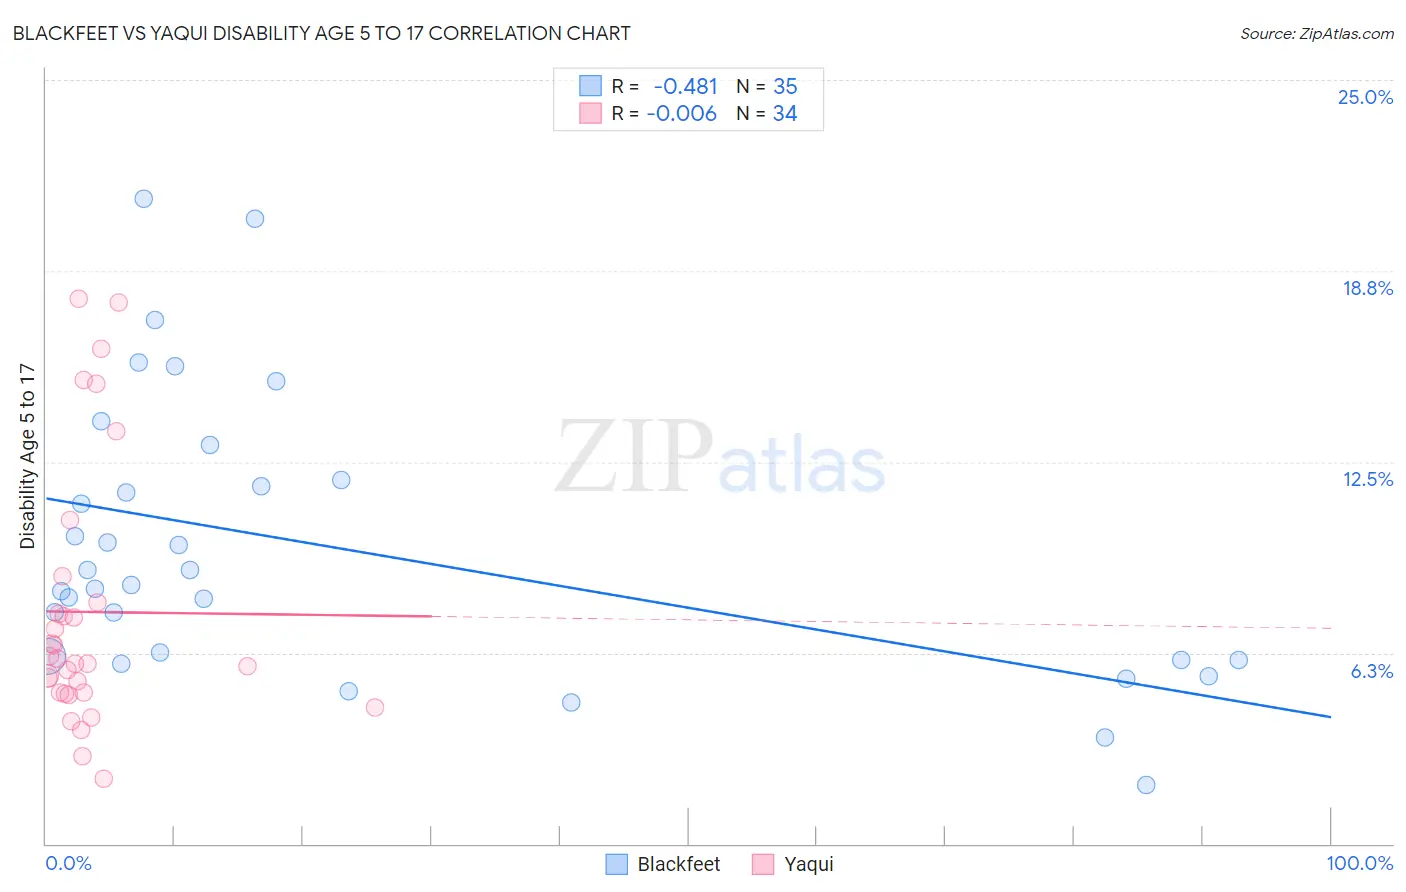
Blackfeet vs Yaqui Disability Age 5 to 17 Correlation Chart
The statistical analysis conducted on geographies consisting of 307,715,312 people shows a moderate negative correlation between the proportion of Blackfeet and percentage of population with a disability between the ages 5 and 17 in the United States with a correlation coefficient (R) of -0.481 and weighted average of 6.6%. Similarly, the statistical analysis conducted on geographies consisting of 107,446,571 people shows no correlation between the proportion of Yaqui and percentage of population with a disability between the ages 5 and 17 in the United States with a correlation coefficient (R) of -0.006 and weighted average of 6.2%, a difference of 6.5%.
Disability Age 5 to 17 Correlation Summary
| Measurement | Blackfeet | Yaqui |
| Minimum | 1.9% | 2.1% |
| Maximum | 21.1% | 17.9% |
| Range | 19.2% | 15.7% |
| Mean | 9.7% | 7.6% |
| Median | 8.5% | 6.0% |
| Interquartile 25% (IQ1) | 6.0% | 4.9% |
| Interquartile 75% (IQ3) | 11.9% | 7.9% |
| Interquartile Range (IQR) | 5.9% | 2.9% |
| Standard Deviation (Sample) | 4.6% | 4.3% |
| Standard Deviation (Population) | 4.5% | 4.2% |
Similar Demographics by Disability Age 5 to 17
Demographics Similar to Blackfeet by Disability Age 5 to 17
In terms of disability age 5 to 17, the demographic groups most similar to Blackfeet are Pennsylvania German (6.6%, a difference of 0.17%), French American Indian (6.6%, a difference of 0.40%), Potawatomi (6.5%, a difference of 0.84%), American (6.5%, a difference of 0.97%), and Dominican (6.5%, a difference of 1.0%).
| Demographics | Rating | Rank | Disability Age 5 to 17 |
| Slovaks | 0.0 /100 | #322 | Tragic 6.5% |
| Osage | 0.0 /100 | #323 | Tragic 6.5% |
| Dominicans | 0.0 /100 | #324 | Tragic 6.5% |
| Americans | 0.0 /100 | #325 | Tragic 6.5% |
| Potawatomi | 0.0 /100 | #326 | Tragic 6.5% |
| French American Indians | 0.0 /100 | #327 | Tragic 6.6% |
| Pennsylvania Germans | 0.0 /100 | #328 | Tragic 6.6% |
| Blackfeet | 0.0 /100 | #329 | Tragic 6.6% |
| Dutch West Indians | 0.0 /100 | #330 | Tragic 6.7% |
| French Canadians | 0.0 /100 | #331 | Tragic 6.7% |
| Immigrants | Azores | 0.0 /100 | #332 | Tragic 6.7% |
| Blacks/African Americans | 0.0 /100 | #333 | Tragic 6.8% |
| Seminole | 0.0 /100 | #334 | Tragic 6.8% |
| Ottawa | 0.0 /100 | #335 | Tragic 6.8% |
| Chickasaw | 0.0 /100 | #336 | Tragic 6.8% |
Demographics Similar to Yaqui by Disability Age 5 to 17
In terms of disability age 5 to 17, the demographic groups most similar to Yaqui are Immigrants from Congo (6.2%, a difference of 0.0%), Jamaican (6.2%, a difference of 0.010%), White/Caucasian (6.2%, a difference of 0.15%), Pima (6.2%, a difference of 0.27%), and Immigrants from Senegal (6.2%, a difference of 0.39%).
| Demographics | Rating | Rank | Disability Age 5 to 17 |
| Germans | 0.0 /100 | #282 | Tragic 6.1% |
| Ugandans | 0.0 /100 | #283 | Tragic 6.2% |
| Sub-Saharan Africans | 0.0 /100 | #284 | Tragic 6.2% |
| English | 0.0 /100 | #285 | Tragic 6.2% |
| Colville | 0.0 /100 | #286 | Tragic 6.2% |
| Pima | 0.0 /100 | #287 | Tragic 6.2% |
| Jamaicans | 0.0 /100 | #288 | Tragic 6.2% |
| Yaqui | 0.0 /100 | #289 | Tragic 6.2% |
| Immigrants | Congo | 0.0 /100 | #290 | Tragic 6.2% |
| Whites/Caucasians | 0.0 /100 | #291 | Tragic 6.2% |
| Immigrants | Senegal | 0.0 /100 | #292 | Tragic 6.2% |
| Central American Indians | 0.0 /100 | #293 | Tragic 6.2% |
| Irish | 0.0 /100 | #294 | Tragic 6.2% |
| Cree | 0.0 /100 | #295 | Tragic 6.2% |
| Spanish Americans | 0.0 /100 | #296 | Tragic 6.2% |