Blackfeet vs Cypriot Disability Age 5 to 17
COMPARE
Blackfeet
Cypriot
Disability Age 5 to 17
Disability Age 5 to 17 Comparison
Blackfeet
Cypriots
6.6%
DISABILITY AGE 5 TO 17
0.0/ 100
METRIC RATING
329th/ 347
METRIC RANK
5.3%
DISABILITY AGE 5 TO 17
97.7/ 100
METRIC RATING
116th/ 347
METRIC RANK
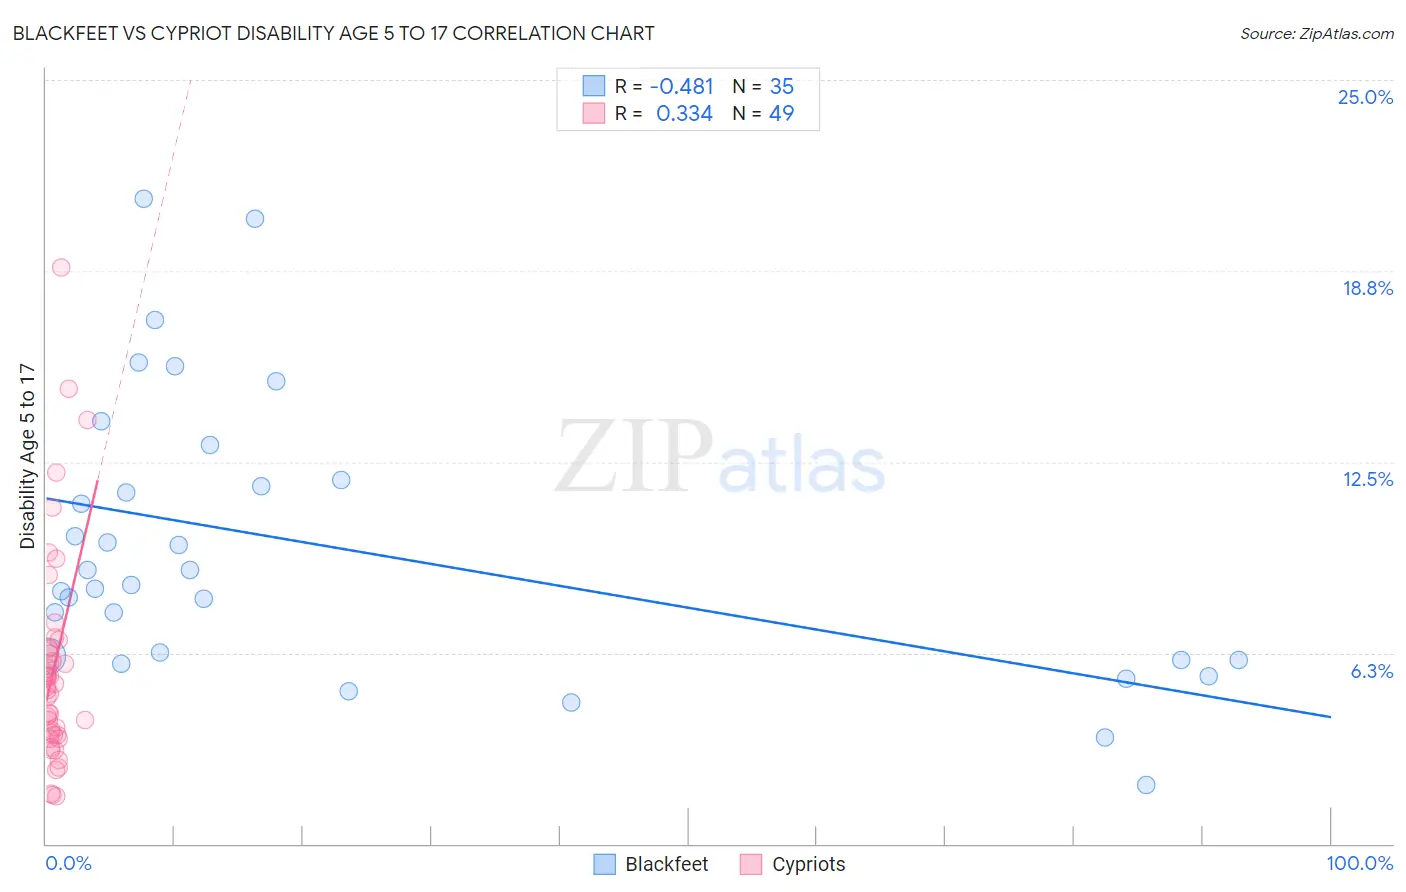
Blackfeet vs Cypriot Disability Age 5 to 17 Correlation Chart
The statistical analysis conducted on geographies consisting of 307,715,312 people shows a moderate negative correlation between the proportion of Blackfeet and percentage of population with a disability between the ages 5 and 17 in the United States with a correlation coefficient (R) of -0.481 and weighted average of 6.6%. Similarly, the statistical analysis conducted on geographies consisting of 61,709,626 people shows a mild positive correlation between the proportion of Cypriots and percentage of population with a disability between the ages 5 and 17 in the United States with a correlation coefficient (R) of 0.334 and weighted average of 5.3%, a difference of 23.4%.
Disability Age 5 to 17 Correlation Summary
| Measurement | Blackfeet | Cypriot |
| Minimum | 1.9% | 1.6% |
| Maximum | 21.1% | 18.9% |
| Range | 19.2% | 17.3% |
| Mean | 9.7% | 5.8% |
| Median | 8.5% | 5.2% |
| Interquartile 25% (IQ1) | 6.0% | 3.6% |
| Interquartile 75% (IQ3) | 11.9% | 6.4% |
| Interquartile Range (IQR) | 5.9% | 2.9% |
| Standard Deviation (Sample) | 4.6% | 3.5% |
| Standard Deviation (Population) | 4.5% | 3.5% |
Similar Demographics by Disability Age 5 to 17
Demographics Similar to Blackfeet by Disability Age 5 to 17
In terms of disability age 5 to 17, the demographic groups most similar to Blackfeet are Pennsylvania German (6.6%, a difference of 0.17%), French American Indian (6.6%, a difference of 0.40%), Potawatomi (6.5%, a difference of 0.84%), American (6.5%, a difference of 0.97%), and Dominican (6.5%, a difference of 1.0%).
| Demographics | Rating | Rank | Disability Age 5 to 17 |
| Slovaks | 0.0 /100 | #322 | Tragic 6.5% |
| Osage | 0.0 /100 | #323 | Tragic 6.5% |
| Dominicans | 0.0 /100 | #324 | Tragic 6.5% |
| Americans | 0.0 /100 | #325 | Tragic 6.5% |
| Potawatomi | 0.0 /100 | #326 | Tragic 6.5% |
| French American Indians | 0.0 /100 | #327 | Tragic 6.6% |
| Pennsylvania Germans | 0.0 /100 | #328 | Tragic 6.6% |
| Blackfeet | 0.0 /100 | #329 | Tragic 6.6% |
| Dutch West Indians | 0.0 /100 | #330 | Tragic 6.7% |
| French Canadians | 0.0 /100 | #331 | Tragic 6.7% |
| Immigrants | Azores | 0.0 /100 | #332 | Tragic 6.7% |
| Blacks/African Americans | 0.0 /100 | #333 | Tragic 6.8% |
| Seminole | 0.0 /100 | #334 | Tragic 6.8% |
| Ottawa | 0.0 /100 | #335 | Tragic 6.8% |
| Chickasaw | 0.0 /100 | #336 | Tragic 6.8% |
Demographics Similar to Cypriots by Disability Age 5 to 17
In terms of disability age 5 to 17, the demographic groups most similar to Cypriots are Cuban (5.3%, a difference of 0.060%), Immigrants from Northern Europe (5.3%, a difference of 0.080%), Aleut (5.3%, a difference of 0.10%), Immigrants from Latvia (5.3%, a difference of 0.15%), and Ethiopian (5.3%, a difference of 0.16%).
| Demographics | Rating | Rank | Disability Age 5 to 17 |
| Immigrants | Northern Africa | 98.1 /100 | #109 | Exceptional 5.3% |
| Immigrants | Eritrea | 98.0 /100 | #110 | Exceptional 5.3% |
| Ethiopians | 97.9 /100 | #111 | Exceptional 5.3% |
| Immigrants | Latvia | 97.9 /100 | #112 | Exceptional 5.3% |
| Aleuts | 97.8 /100 | #113 | Exceptional 5.3% |
| Immigrants | Northern Europe | 97.8 /100 | #114 | Exceptional 5.3% |
| Cubans | 97.8 /100 | #115 | Exceptional 5.3% |
| Cypriots | 97.7 /100 | #116 | Exceptional 5.3% |
| Immigrants | Afghanistan | 97.4 /100 | #117 | Exceptional 5.3% |
| South Americans | 97.1 /100 | #118 | Exceptional 5.4% |
| Immigrants | South America | 97.1 /100 | #119 | Exceptional 5.4% |
| Immigrants | Immigrants | 97.0 /100 | #120 | Exceptional 5.4% |
| Maltese | 96.0 /100 | #121 | Exceptional 5.4% |
| Chileans | 95.8 /100 | #122 | Exceptional 5.4% |
| Immigrants | Ethiopia | 95.5 /100 | #123 | Exceptional 5.4% |