Blackfeet vs Immigrants from Honduras Cognitive Disability
COMPARE
Blackfeet
Immigrants from Honduras
Cognitive Disability
Cognitive Disability Comparison
Blackfeet
Immigrants from Honduras
18.3%
COGNITIVE DISABILITY
0.0/ 100
METRIC RATING
297th/ 347
METRIC RANK
18.0%
COGNITIVE DISABILITY
0.2/ 100
METRIC RATING
272nd/ 347
METRIC RANK
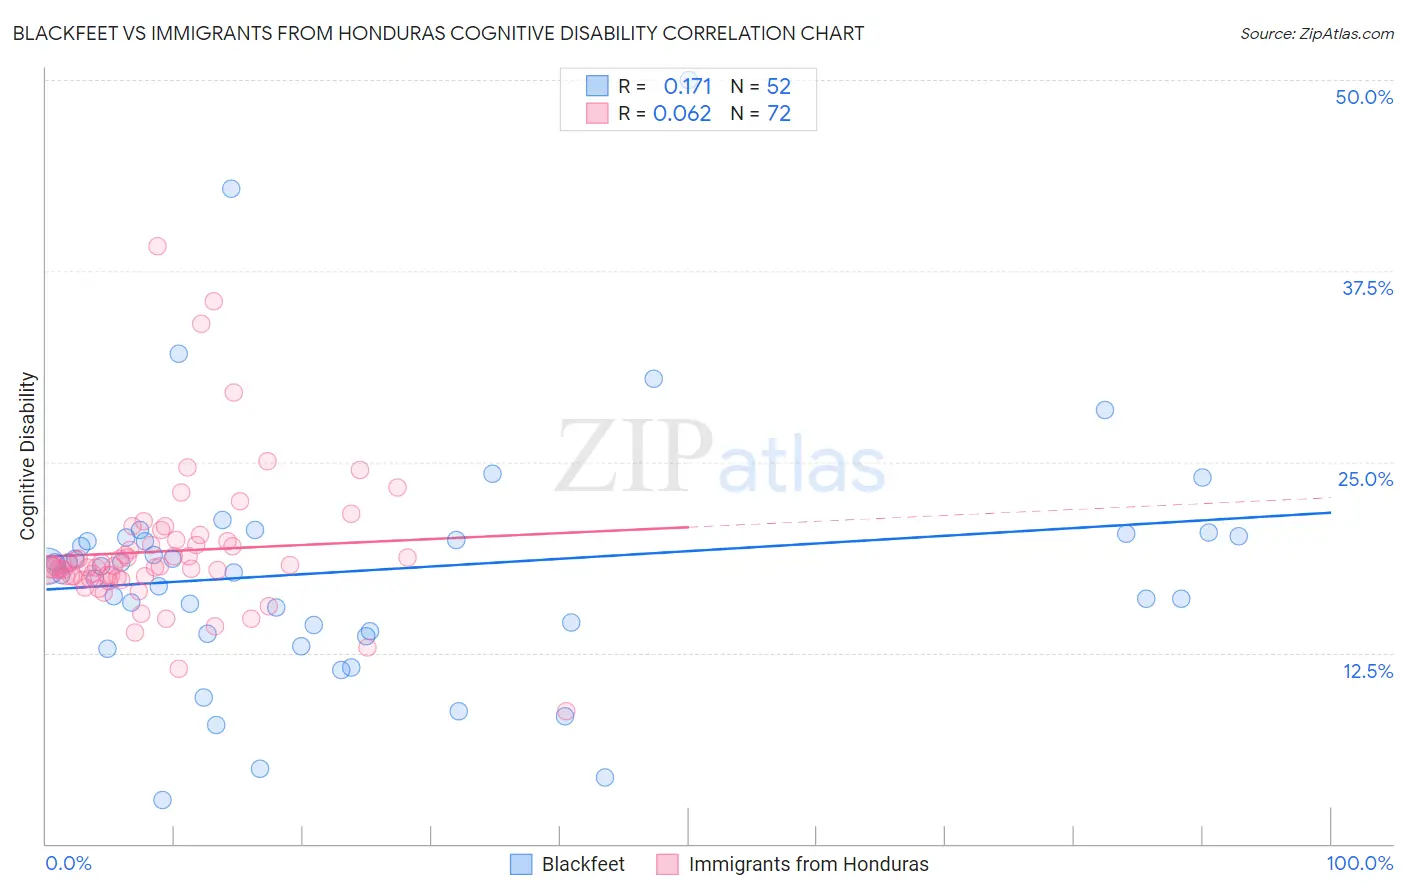
Blackfeet vs Immigrants from Honduras Cognitive Disability Correlation Chart
The statistical analysis conducted on geographies consisting of 309,516,270 people shows a poor positive correlation between the proportion of Blackfeet and percentage of population with cognitive disability in the United States with a correlation coefficient (R) of 0.171 and weighted average of 18.3%. Similarly, the statistical analysis conducted on geographies consisting of 322,550,797 people shows a slight positive correlation between the proportion of Immigrants from Honduras and percentage of population with cognitive disability in the United States with a correlation coefficient (R) of 0.062 and weighted average of 18.0%, a difference of 1.3%.
Cognitive Disability Correlation Summary
| Measurement | Blackfeet | Immigrants from Honduras |
| Minimum | 2.8% | 8.7% |
| Maximum | 50.0% | 39.1% |
| Range | 47.2% | 30.5% |
| Mean | 17.9% | 19.1% |
| Median | 18.0% | 18.1% |
| Interquartile 25% (IQ1) | 13.8% | 17.5% |
| Interquartile 75% (IQ3) | 20.1% | 19.7% |
| Interquartile Range (IQR) | 6.3% | 2.2% |
| Standard Deviation (Sample) | 8.2% | 4.7% |
| Standard Deviation (Population) | 8.1% | 4.7% |
Similar Demographics by Cognitive Disability
Demographics Similar to Blackfeet by Cognitive Disability
In terms of cognitive disability, the demographic groups most similar to Blackfeet are Japanese (18.3%, a difference of 0.0%), Ghanaian (18.3%, a difference of 0.040%), Creek (18.3%, a difference of 0.060%), Immigrants from Burma/Myanmar (18.2%, a difference of 0.14%), and German Russian (18.2%, a difference of 0.17%).
| Demographics | Rating | Rank | Cognitive Disability |
| Immigrants | Africa | 0.1 /100 | #290 | Tragic 18.1% |
| Ottawa | 0.1 /100 | #291 | Tragic 18.2% |
| Iroquois | 0.1 /100 | #292 | Tragic 18.2% |
| Central American Indians | 0.1 /100 | #293 | Tragic 18.2% |
| British West Indians | 0.1 /100 | #294 | Tragic 18.2% |
| German Russians | 0.0 /100 | #295 | Tragic 18.2% |
| Immigrants | Burma/Myanmar | 0.0 /100 | #296 | Tragic 18.2% |
| Blackfeet | 0.0 /100 | #297 | Tragic 18.3% |
| Japanese | 0.0 /100 | #298 | Tragic 18.3% |
| Ghanaians | 0.0 /100 | #299 | Tragic 18.3% |
| Creek | 0.0 /100 | #300 | Tragic 18.3% |
| Immigrants | Ghana | 0.0 /100 | #301 | Tragic 18.3% |
| Barbadians | 0.0 /100 | #302 | Tragic 18.3% |
| Immigrants | Kenya | 0.0 /100 | #303 | Tragic 18.3% |
| Immigrants | Eritrea | 0.0 /100 | #304 | Tragic 18.3% |
Demographics Similar to Immigrants from Honduras by Cognitive Disability
In terms of cognitive disability, the demographic groups most similar to Immigrants from Honduras are Potawatomi (18.0%, a difference of 0.010%), Immigrants from Bahamas (18.0%, a difference of 0.090%), Honduran (18.0%, a difference of 0.10%), Immigrants from Nepal (18.0%, a difference of 0.12%), and Immigrants from Nigeria (18.0%, a difference of 0.13%).
| Demographics | Rating | Rank | Cognitive Disability |
| Spanish Americans | 0.4 /100 | #265 | Tragic 18.0% |
| Belizeans | 0.4 /100 | #266 | Tragic 18.0% |
| Nepalese | 0.3 /100 | #267 | Tragic 18.0% |
| Cherokee | 0.3 /100 | #268 | Tragic 18.0% |
| Hondurans | 0.3 /100 | #269 | Tragic 18.0% |
| Immigrants | Bahamas | 0.3 /100 | #270 | Tragic 18.0% |
| Potawatomi | 0.2 /100 | #271 | Tragic 18.0% |
| Immigrants | Honduras | 0.2 /100 | #272 | Tragic 18.0% |
| Immigrants | Nepal | 0.2 /100 | #273 | Tragic 18.0% |
| Immigrants | Nigeria | 0.2 /100 | #274 | Tragic 18.0% |
| Immigrants | Laos | 0.2 /100 | #275 | Tragic 18.1% |
| Yuman | 0.2 /100 | #276 | Tragic 18.1% |
| Immigrants | Kuwait | 0.2 /100 | #277 | Tragic 18.1% |
| Immigrants | Micronesia | 0.2 /100 | #278 | Tragic 18.1% |
| Chippewa | 0.1 /100 | #279 | Tragic 18.1% |