Bermudan vs Mongolian 10th Grade
COMPARE
Bermudan
Mongolian
10th Grade
10th Grade Comparison
Bermudans
Mongolians
93.9%
10TH GRADE
71.0/ 100
METRIC RATING
158th/ 347
METRIC RANK
94.0%
10TH GRADE
74.4/ 100
METRIC RATING
156th/ 347
METRIC RANK
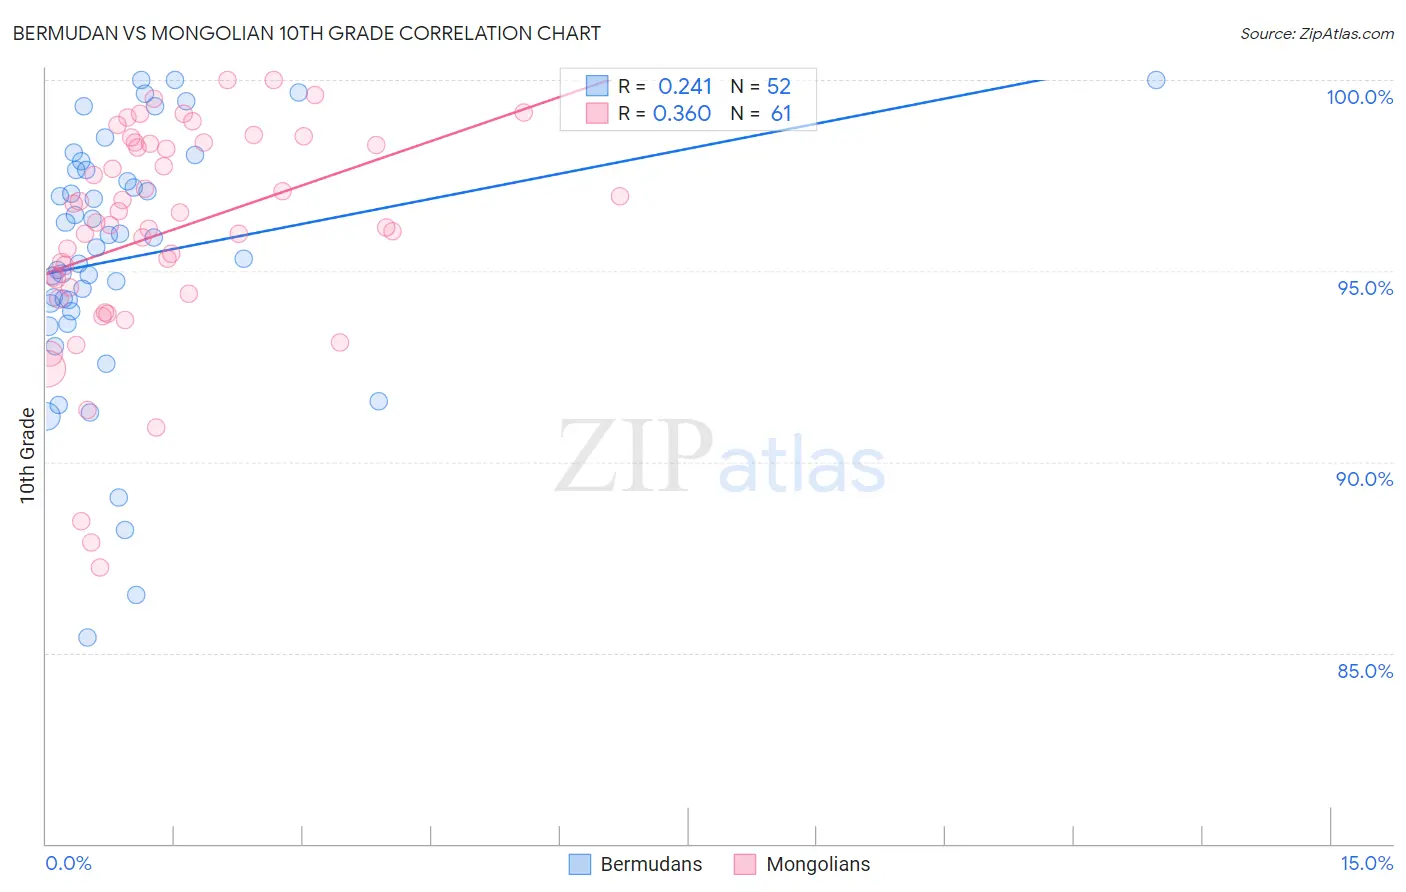
Bermudan vs Mongolian 10th Grade Correlation Chart
The statistical analysis conducted on geographies consisting of 55,730,379 people shows a weak positive correlation between the proportion of Bermudans and percentage of population with at least 10th grade education in the United States with a correlation coefficient (R) of 0.241 and weighted average of 93.9%. Similarly, the statistical analysis conducted on geographies consisting of 140,362,004 people shows a mild positive correlation between the proportion of Mongolians and percentage of population with at least 10th grade education in the United States with a correlation coefficient (R) of 0.360 and weighted average of 94.0%, a difference of 0.040%.
10th Grade Correlation Summary
| Measurement | Bermudan | Mongolian |
| Minimum | 85.4% | 87.2% |
| Maximum | 100.0% | 100.0% |
| Range | 14.6% | 12.8% |
| Mean | 95.3% | 96.0% |
| Median | 95.8% | 96.3% |
| Interquartile 25% (IQ1) | 94.0% | 94.5% |
| Interquartile 75% (IQ3) | 97.7% | 98.3% |
| Interquartile Range (IQR) | 3.6% | 3.9% |
| Standard Deviation (Sample) | 3.4% | 2.9% |
| Standard Deviation (Population) | 3.3% | 2.9% |
Demographics Similar to Bermudans and Mongolians by 10th Grade
In terms of 10th grade, the demographic groups most similar to Bermudans are Chilean (93.9%, a difference of 0.010%), Pakistani (93.9%, a difference of 0.010%), Assyrian/Chaldean/Syriac (93.9%, a difference of 0.010%), Immigrants from Poland (93.9%, a difference of 0.020%), and Venezuelan (93.9%, a difference of 0.020%). Similarly, the demographic groups most similar to Mongolians are Immigrants from Brazil (94.0%, a difference of 0.010%), Immigrants from Kenya (94.0%, a difference of 0.010%), Spanish (94.0%, a difference of 0.010%), Kiowa (93.9%, a difference of 0.010%), and Immigrants from Italy (94.0%, a difference of 0.040%).
| Demographics | Rating | Rank | 10th Grade |
| Immigrants | Ukraine | 81.5 /100 | #147 | Excellent 94.0% |
| Arabs | 80.9 /100 | #148 | Excellent 94.0% |
| Ugandans | 80.7 /100 | #149 | Excellent 94.0% |
| Egyptians | 79.6 /100 | #150 | Good 94.0% |
| Kenyans | 79.1 /100 | #151 | Good 94.0% |
| Immigrants | Italy | 78.0 /100 | #152 | Good 94.0% |
| Immigrants | Brazil | 75.5 /100 | #153 | Good 94.0% |
| Immigrants | Kenya | 75.3 /100 | #154 | Good 94.0% |
| Spanish | 74.9 /100 | #155 | Good 94.0% |
| Mongolians | 74.4 /100 | #156 | Good 94.0% |
| Kiowa | 73.3 /100 | #157 | Good 93.9% |
| Bermudans | 71.0 /100 | #158 | Good 93.9% |
| Chileans | 70.2 /100 | #159 | Good 93.9% |
| Pakistanis | 70.1 /100 | #160 | Good 93.9% |
| Assyrians/Chaldeans/Syriacs | 69.7 /100 | #161 | Good 93.9% |
| Immigrants | Poland | 69.6 /100 | #162 | Good 93.9% |
| Venezuelans | 69.5 /100 | #163 | Good 93.9% |
| Iraqis | 68.1 /100 | #164 | Good 93.9% |
| Brazilians | 63.6 /100 | #165 | Good 93.8% |
| Immigrants | Iraq | 63.0 /100 | #166 | Good 93.8% |
| Immigrants | Egypt | 62.3 /100 | #167 | Good 93.8% |