Basque vs Portuguese Disability Age 65 to 74
COMPARE
Basque
Portuguese
Disability Age 65 to 74
Disability Age 65 to 74 Comparison
Basques
Portuguese
23.5%
DISABILITY AGE 65 TO 74
38.4/ 100
METRIC RATING
186th/ 347
METRIC RANK
23.5%
DISABILITY AGE 65 TO 74
37.8/ 100
METRIC RATING
187th/ 347
METRIC RANK
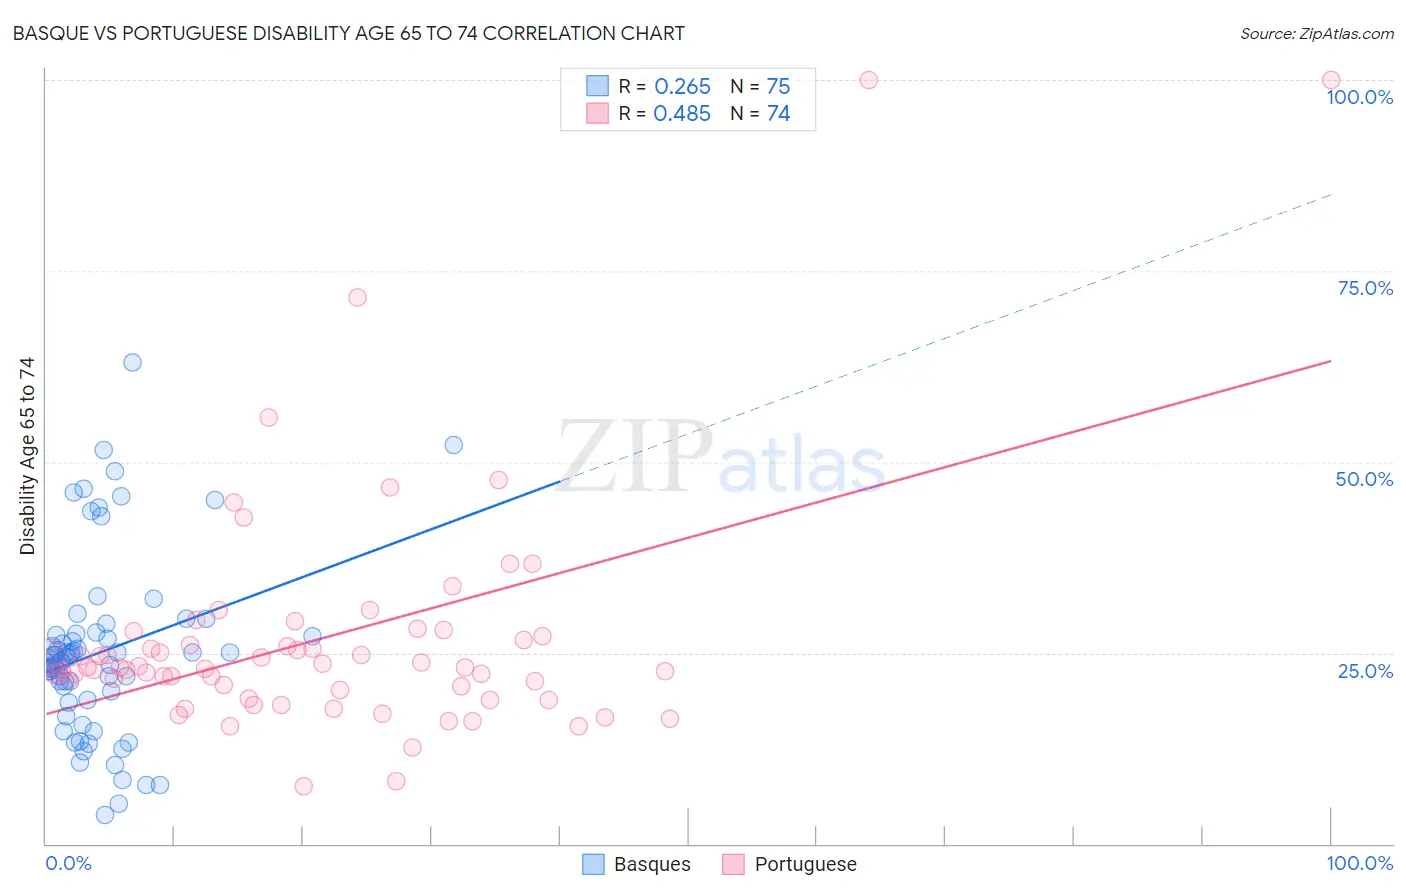
Basque vs Portuguese Disability Age 65 to 74 Correlation Chart
The statistical analysis conducted on geographies consisting of 165,654,682 people shows a weak positive correlation between the proportion of Basques and percentage of population with a disability between the ages 65 and 75 in the United States with a correlation coefficient (R) of 0.265 and weighted average of 23.5%. Similarly, the statistical analysis conducted on geographies consisting of 449,216,913 people shows a moderate positive correlation between the proportion of Portuguese and percentage of population with a disability between the ages 65 and 75 in the United States with a correlation coefficient (R) of 0.485 and weighted average of 23.5%, a difference of 0.040%.
Disability Age 65 to 74 Correlation Summary
| Measurement | Basque | Portuguese |
| Minimum | 3.8% | 7.5% |
| Maximum | 63.0% | 100.0% |
| Range | 59.1% | 92.5% |
| Mean | 25.1% | 27.0% |
| Median | 24.0% | 23.0% |
| Interquartile 25% (IQ1) | 18.7% | 20.1% |
| Interquartile 75% (IQ3) | 27.6% | 27.1% |
| Interquartile Range (IQR) | 8.8% | 7.0% |
| Standard Deviation (Sample) | 11.6% | 15.8% |
| Standard Deviation (Population) | 11.6% | 15.7% |
Demographics Similar to Basques and Portuguese by Disability Age 65 to 74
In terms of disability age 65 to 74, the demographic groups most similar to Basques are Haitian (23.4%, a difference of 0.24%), Immigrants from Germany (23.4%, a difference of 0.25%), Immigrants from Eastern Africa (23.4%, a difference of 0.27%), Immigrants from Cuba (23.6%, a difference of 0.27%), and Scottish (23.6%, a difference of 0.33%). Similarly, the demographic groups most similar to Portuguese are Immigrants from Cuba (23.6%, a difference of 0.24%), Haitian (23.4%, a difference of 0.28%), Immigrants from Germany (23.4%, a difference of 0.29%), Immigrants from Eastern Africa (23.4%, a difference of 0.30%), and Scottish (23.6%, a difference of 0.30%).
| Demographics | Rating | Rank | Disability Age 65 to 74 |
| Immigrants | Eritrea | 47.5 /100 | #176 | Average 23.4% |
| Immigrants | Haiti | 47.5 /100 | #177 | Average 23.4% |
| Guyanese | 45.8 /100 | #178 | Average 23.4% |
| Immigrants | Sierra Leone | 45.8 /100 | #179 | Average 23.4% |
| Scandinavians | 45.6 /100 | #180 | Average 23.4% |
| Assyrians/Chaldeans/Syriacs | 45.3 /100 | #181 | Average 23.4% |
| Irish | 44.4 /100 | #182 | Average 23.4% |
| Immigrants | Eastern Africa | 42.8 /100 | #183 | Average 23.4% |
| Immigrants | Germany | 42.5 /100 | #184 | Average 23.4% |
| Haitians | 42.4 /100 | #185 | Average 23.4% |
| Basques | 38.4 /100 | #186 | Fair 23.5% |
| Portuguese | 37.8 /100 | #187 | Fair 23.5% |
| Immigrants | Cuba | 34.0 /100 | #188 | Fair 23.6% |
| Scottish | 33.1 /100 | #189 | Fair 23.6% |
| Immigrants | Guyana | 31.2 /100 | #190 | Fair 23.6% |
| Immigrants | Bangladesh | 30.2 /100 | #191 | Fair 23.6% |
| Ecuadorians | 29.7 /100 | #192 | Fair 23.6% |
| English | 28.5 /100 | #193 | Fair 23.6% |
| Sudanese | 27.8 /100 | #194 | Fair 23.7% |
| Immigrants | St. Vincent and the Grenadines | 26.1 /100 | #195 | Fair 23.7% |
| Immigrants | Trinidad and Tobago | 26.1 /100 | #196 | Fair 23.7% |