Immigrants from Belize vs Portuguese Self-Care Disability
COMPARE
Immigrants from Belize
Portuguese
Self-Care Disability
Self-Care Disability Comparison
Immigrants from Belize
Portuguese
2.8%
SELF-CARE DISABILITY
0.0/ 100
METRIC RATING
303rd/ 347
METRIC RANK
2.6%
SELF-CARE DISABILITY
0.4/ 100
METRIC RATING
250th/ 347
METRIC RANK
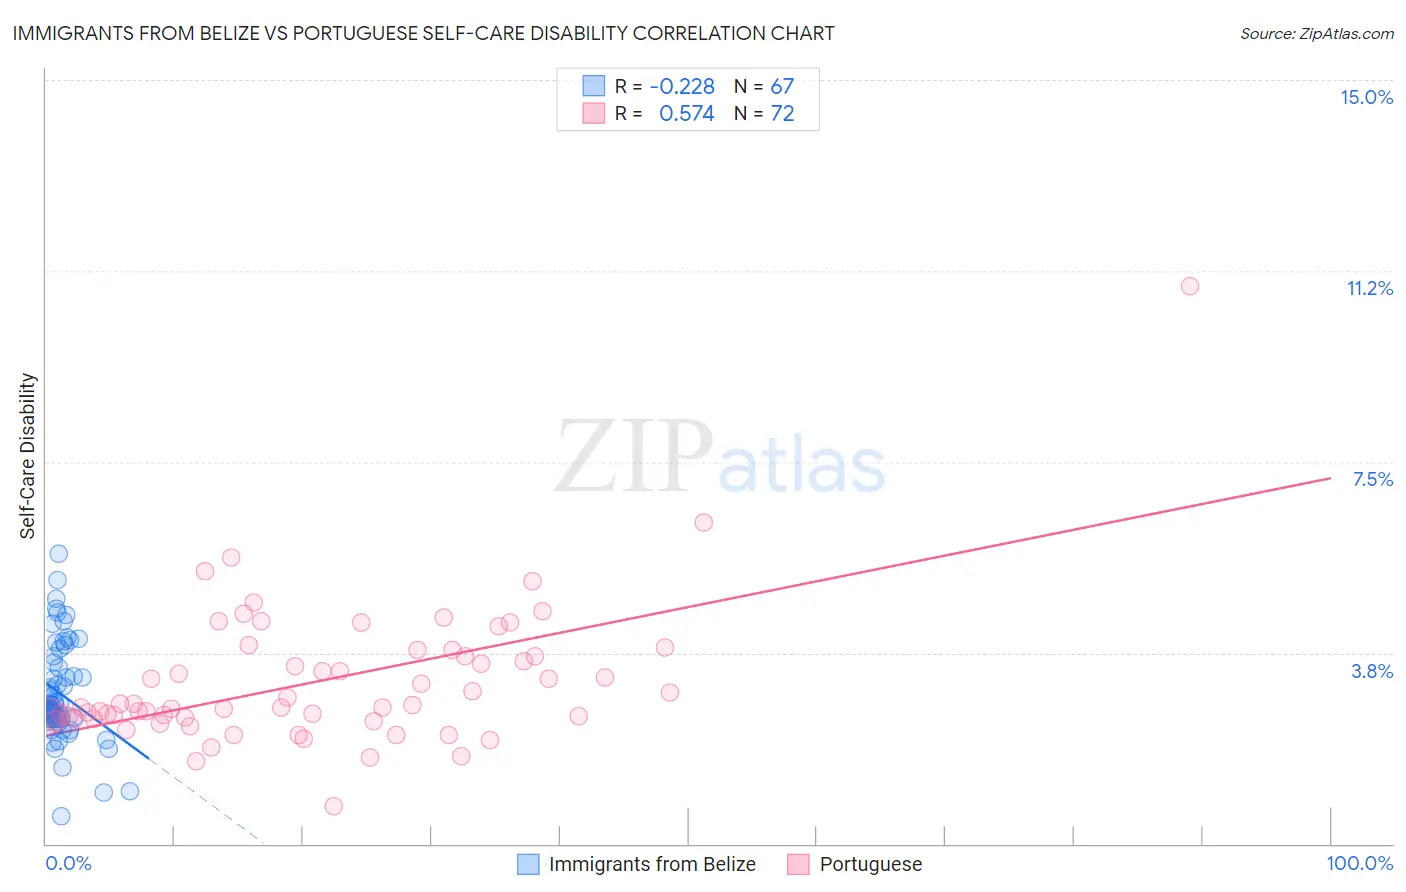
Immigrants from Belize vs Portuguese Self-Care Disability Correlation Chart
The statistical analysis conducted on geographies consisting of 130,238,734 people shows a weak negative correlation between the proportion of Immigrants from Belize and percentage of population with self-care disability in the United States with a correlation coefficient (R) of -0.228 and weighted average of 2.8%. Similarly, the statistical analysis conducted on geographies consisting of 449,515,942 people shows a substantial positive correlation between the proportion of Portuguese and percentage of population with self-care disability in the United States with a correlation coefficient (R) of 0.574 and weighted average of 2.6%, a difference of 6.1%.
Self-Care Disability Correlation Summary
| Measurement | Immigrants from Belize | Portuguese |
| Minimum | 0.53% | 0.74% |
| Maximum | 5.7% | 11.0% |
| Range | 5.2% | 10.2% |
| Mean | 2.9% | 3.2% |
| Median | 2.7% | 2.7% |
| Interquartile 25% (IQ1) | 2.4% | 2.5% |
| Interquartile 75% (IQ3) | 3.6% | 3.7% |
| Interquartile Range (IQR) | 1.1% | 1.3% |
| Standard Deviation (Sample) | 0.98% | 1.4% |
| Standard Deviation (Population) | 0.97% | 1.4% |
Similar Demographics by Self-Care Disability
Demographics Similar to Immigrants from Belize by Self-Care Disability
In terms of self-care disability, the demographic groups most similar to Immigrants from Belize are Immigrants from St. Vincent and the Grenadines (2.8%, a difference of 0.15%), Cree (2.8%, a difference of 0.16%), Pima (2.8%, a difference of 0.18%), Immigrants from West Indies (2.8%, a difference of 0.20%), and Immigrants from Fiji (2.8%, a difference of 0.28%).
| Demographics | Rating | Rank | Self-Care Disability |
| Immigrants | Portugal | 0.0 /100 | #296 | Tragic 2.8% |
| West Indians | 0.0 /100 | #297 | Tragic 2.8% |
| Americans | 0.0 /100 | #298 | Tragic 2.8% |
| Immigrants | Guyana | 0.0 /100 | #299 | Tragic 2.8% |
| Immigrants | Fiji | 0.0 /100 | #300 | Tragic 2.8% |
| Pima | 0.0 /100 | #301 | Tragic 2.8% |
| Immigrants | St. Vincent and the Grenadines | 0.0 /100 | #302 | Tragic 2.8% |
| Immigrants | Belize | 0.0 /100 | #303 | Tragic 2.8% |
| Cree | 0.0 /100 | #304 | Tragic 2.8% |
| Immigrants | West Indies | 0.0 /100 | #305 | Tragic 2.8% |
| Aleuts | 0.0 /100 | #306 | Tragic 2.8% |
| Natives/Alaskans | 0.0 /100 | #307 | Tragic 2.8% |
| Immigrants | Grenada | 0.0 /100 | #308 | Tragic 2.8% |
| Bangladeshis | 0.0 /100 | #309 | Tragic 2.8% |
| British West Indians | 0.0 /100 | #310 | Tragic 2.8% |
Demographics Similar to Portuguese by Self-Care Disability
In terms of self-care disability, the demographic groups most similar to Portuguese are Mexican American Indian (2.6%, a difference of 0.080%), Immigrants from Liberia (2.6%, a difference of 0.080%), Immigrants from Bangladesh (2.6%, a difference of 0.15%), Immigrants from Haiti (2.6%, a difference of 0.23%), and Haitian (2.6%, a difference of 0.25%).
| Demographics | Rating | Rank | Self-Care Disability |
| Hawaiians | 0.8 /100 | #243 | Tragic 2.6% |
| Yuman | 0.8 /100 | #244 | Tragic 2.6% |
| Immigrants | Western Asia | 0.6 /100 | #245 | Tragic 2.6% |
| Cheyenne | 0.6 /100 | #246 | Tragic 2.6% |
| Immigrants | Albania | 0.6 /100 | #247 | Tragic 2.6% |
| Nicaraguans | 0.6 /100 | #248 | Tragic 2.6% |
| Mexican American Indians | 0.5 /100 | #249 | Tragic 2.6% |
| Portuguese | 0.4 /100 | #250 | Tragic 2.6% |
| Immigrants | Liberia | 0.4 /100 | #251 | Tragic 2.6% |
| Immigrants | Bangladesh | 0.4 /100 | #252 | Tragic 2.6% |
| Immigrants | Haiti | 0.3 /100 | #253 | Tragic 2.6% |
| Haitians | 0.3 /100 | #254 | Tragic 2.6% |
| Tsimshian | 0.3 /100 | #255 | Tragic 2.6% |
| Immigrants | Central America | 0.3 /100 | #256 | Tragic 2.6% |
| Potawatomi | 0.3 /100 | #257 | Tragic 2.6% |