Cypriot vs Norwegian Self-Care Disability
COMPARE
Cypriot
Norwegian
Self-Care Disability
Self-Care Disability Comparison
Cypriots
Norwegians
2.2%
SELF-CARE DISABILITY
100.0/ 100
METRIC RATING
24th/ 347
METRIC RANK
2.3%
SELF-CARE DISABILITY
99.8/ 100
METRIC RATING
45th/ 347
METRIC RANK
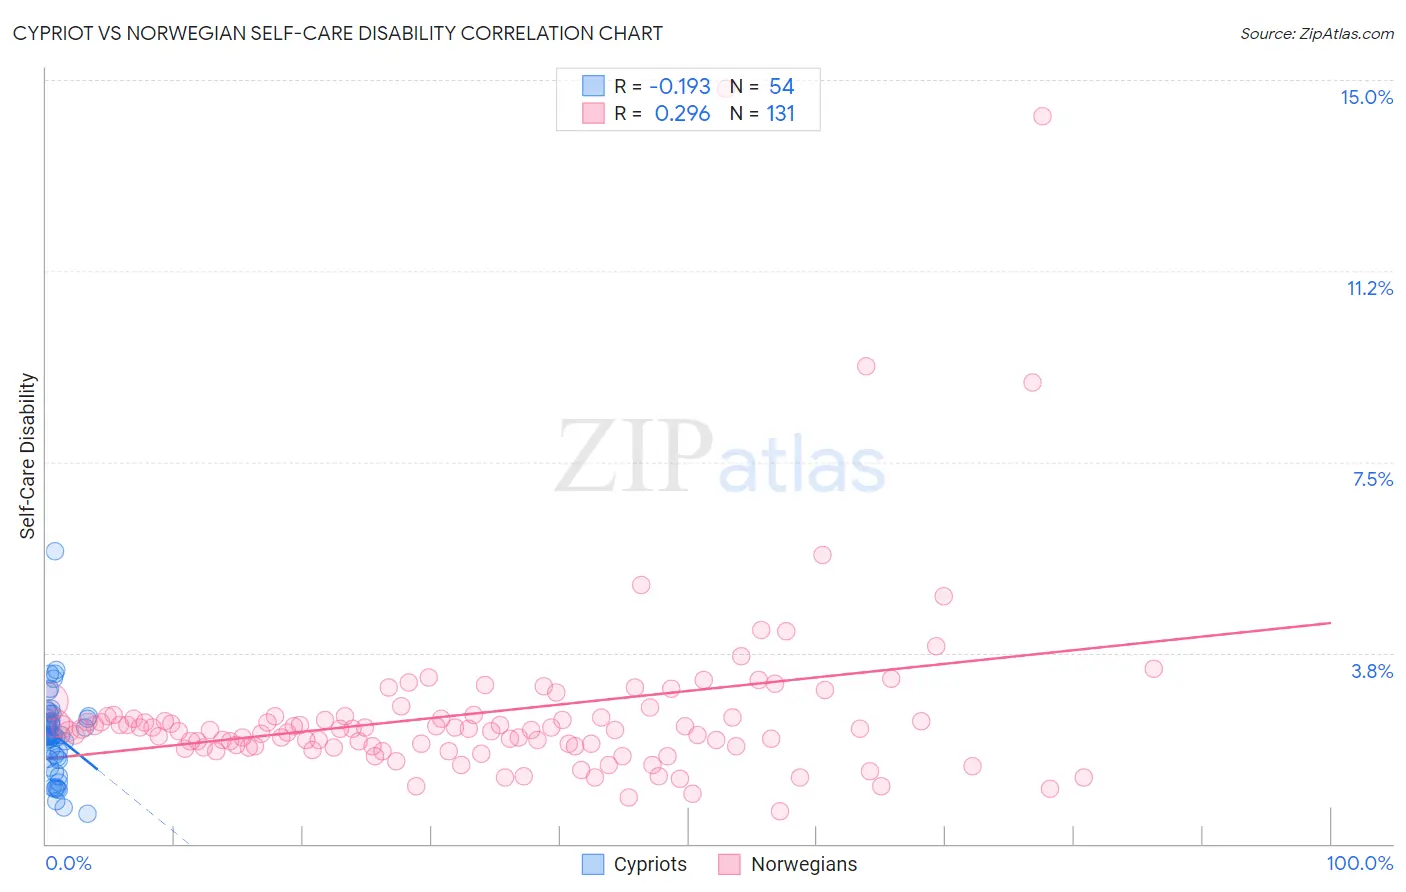
Cypriot vs Norwegian Self-Care Disability Correlation Chart
The statistical analysis conducted on geographies consisting of 61,833,470 people shows a poor negative correlation between the proportion of Cypriots and percentage of population with self-care disability in the United States with a correlation coefficient (R) of -0.193 and weighted average of 2.2%. Similarly, the statistical analysis conducted on geographies consisting of 531,593,682 people shows a weak positive correlation between the proportion of Norwegians and percentage of population with self-care disability in the United States with a correlation coefficient (R) of 0.296 and weighted average of 2.3%, a difference of 2.0%.
Self-Care Disability Correlation Summary
| Measurement | Cypriot | Norwegian |
| Minimum | 0.60% | 0.64% |
| Maximum | 5.7% | 14.8% |
| Range | 5.1% | 14.2% |
| Mean | 2.1% | 2.6% |
| Median | 2.1% | 2.2% |
| Interquartile 25% (IQ1) | 1.7% | 1.9% |
| Interquartile 75% (IQ3) | 2.5% | 2.5% |
| Interquartile Range (IQR) | 0.80% | 0.60% |
| Standard Deviation (Sample) | 0.84% | 1.9% |
| Standard Deviation (Population) | 0.83% | 1.9% |
Similar Demographics by Self-Care Disability
Demographics Similar to Cypriots by Self-Care Disability
In terms of self-care disability, the demographic groups most similar to Cypriots are Turkish (2.2%, a difference of 0.11%), Immigrants from Sri Lanka (2.2%, a difference of 0.18%), Venezuelan (2.2%, a difference of 0.19%), Cambodian (2.2%, a difference of 0.30%), and Inupiat (2.2%, a difference of 0.35%).
| Demographics | Rating | Rank | Self-Care Disability |
| Immigrants | Saudi Arabia | 100.0 /100 | #17 | Exceptional 2.2% |
| Immigrants | Taiwan | 100.0 /100 | #18 | Exceptional 2.2% |
| Immigrants | Eritrea | 100.0 /100 | #19 | Exceptional 2.2% |
| Tongans | 100.0 /100 | #20 | Exceptional 2.2% |
| Bulgarians | 100.0 /100 | #21 | Exceptional 2.2% |
| Immigrants | Venezuela | 100.0 /100 | #22 | Exceptional 2.2% |
| Cambodians | 100.0 /100 | #23 | Exceptional 2.2% |
| Cypriots | 100.0 /100 | #24 | Exceptional 2.2% |
| Turks | 100.0 /100 | #25 | Exceptional 2.2% |
| Immigrants | Sri Lanka | 99.9 /100 | #26 | Exceptional 2.2% |
| Venezuelans | 99.9 /100 | #27 | Exceptional 2.2% |
| Inupiat | 99.9 /100 | #28 | Exceptional 2.2% |
| Immigrants | Zimbabwe | 99.9 /100 | #29 | Exceptional 2.3% |
| Paraguayans | 99.9 /100 | #30 | Exceptional 2.3% |
| Danes | 99.9 /100 | #31 | Exceptional 2.3% |
Demographics Similar to Norwegians by Self-Care Disability
In terms of self-care disability, the demographic groups most similar to Norwegians are Immigrants from South Africa (2.3%, a difference of 0.040%), Czech (2.3%, a difference of 0.080%), Immigrants from Pakistan (2.3%, a difference of 0.090%), Immigrants from Uganda (2.3%, a difference of 0.13%), and Immigrants from Sudan (2.3%, a difference of 0.23%).
| Demographics | Rating | Rank | Self-Care Disability |
| Immigrants | Eastern Africa | 99.9 /100 | #38 | Exceptional 2.3% |
| Immigrants | Bulgaria | 99.8 /100 | #39 | Exceptional 2.3% |
| Iranians | 99.8 /100 | #40 | Exceptional 2.3% |
| Immigrants | Sudan | 99.8 /100 | #41 | Exceptional 2.3% |
| Immigrants | Uganda | 99.8 /100 | #42 | Exceptional 2.3% |
| Immigrants | Pakistan | 99.8 /100 | #43 | Exceptional 2.3% |
| Immigrants | South Africa | 99.8 /100 | #44 | Exceptional 2.3% |
| Norwegians | 99.8 /100 | #45 | Exceptional 2.3% |
| Czechs | 99.8 /100 | #46 | Exceptional 2.3% |
| Jordanians | 99.7 /100 | #47 | Exceptional 2.3% |
| Immigrants | Malaysia | 99.7 /100 | #48 | Exceptional 2.3% |
| Latvians | 99.7 /100 | #49 | Exceptional 2.3% |
| Immigrants | Brazil | 99.7 /100 | #50 | Exceptional 2.3% |
| Kenyans | 99.7 /100 | #51 | Exceptional 2.3% |
| Immigrants | Serbia | 99.6 /100 | #52 | Exceptional 2.3% |