Bahamian vs Immigrants from Austria Self-Care Disability
COMPARE
Bahamian
Immigrants from Austria
Self-Care Disability
Self-Care Disability Comparison
Bahamians
Immigrants from Austria
2.6%
SELF-CARE DISABILITY
2.0/ 100
METRIC RATING
235th/ 347
METRIC RANK
2.4%
SELF-CARE DISABILITY
89.0/ 100
METRIC RATING
130th/ 347
METRIC RANK
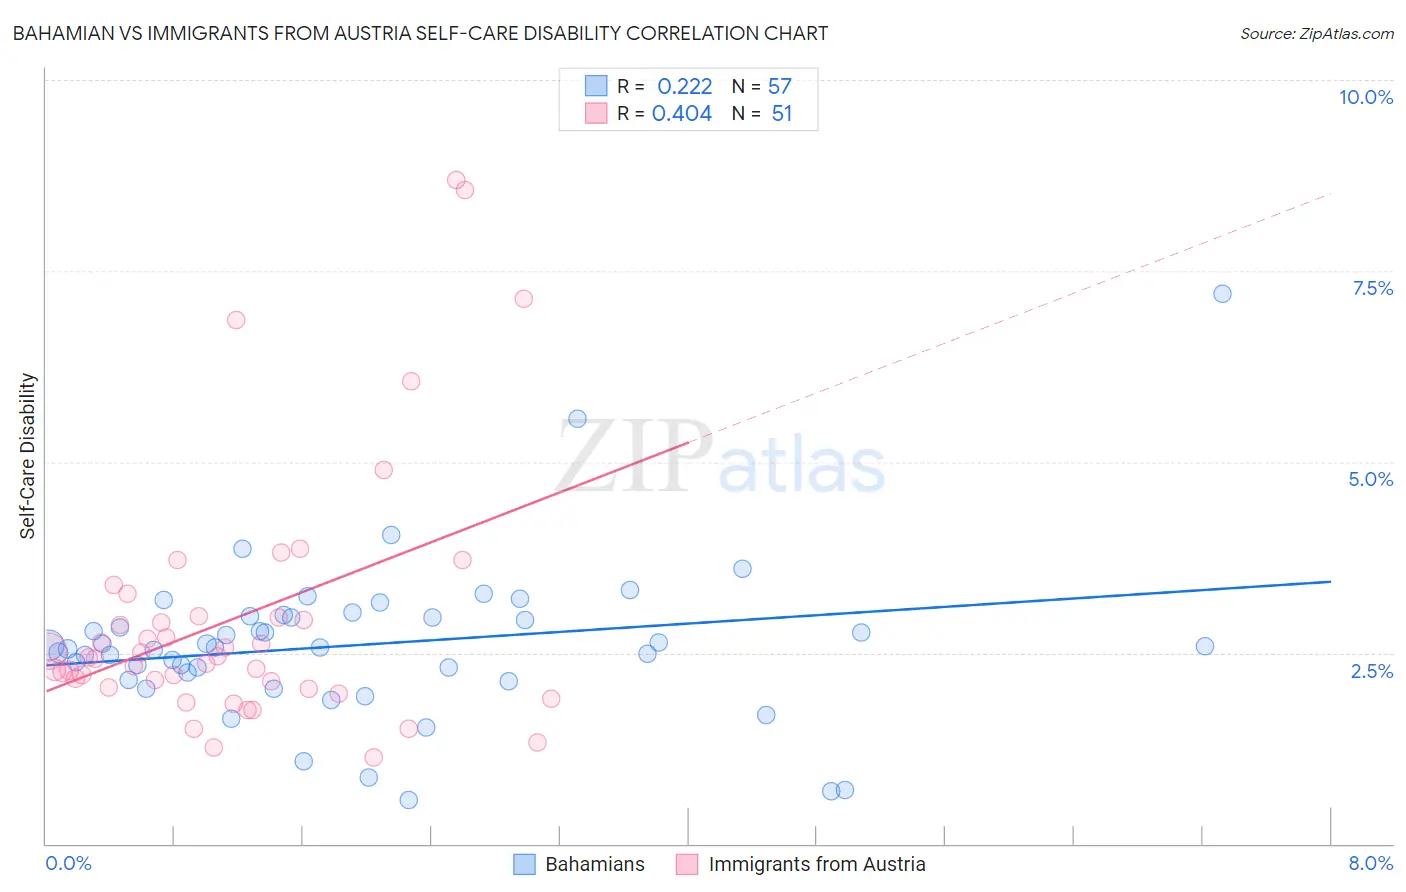
Bahamian vs Immigrants from Austria Self-Care Disability Correlation Chart
The statistical analysis conducted on geographies consisting of 112,612,333 people shows a weak positive correlation between the proportion of Bahamians and percentage of population with self-care disability in the United States with a correlation coefficient (R) of 0.222 and weighted average of 2.6%. Similarly, the statistical analysis conducted on geographies consisting of 167,909,652 people shows a moderate positive correlation between the proportion of Immigrants from Austria and percentage of population with self-care disability in the United States with a correlation coefficient (R) of 0.404 and weighted average of 2.4%, a difference of 7.3%.
Self-Care Disability Correlation Summary
| Measurement | Bahamian | Immigrants from Austria |
| Minimum | 0.58% | 1.1% |
| Maximum | 7.2% | 8.7% |
| Range | 6.6% | 7.6% |
| Mean | 2.6% | 3.0% |
| Median | 2.6% | 2.4% |
| Interquartile 25% (IQ1) | 2.2% | 2.0% |
| Interquartile 75% (IQ3) | 3.0% | 3.0% |
| Interquartile Range (IQR) | 0.77% | 0.94% |
| Standard Deviation (Sample) | 1.0% | 1.7% |
| Standard Deviation (Population) | 1.0% | 1.7% |
Similar Demographics by Self-Care Disability
Demographics Similar to Bahamians by Self-Care Disability
In terms of self-care disability, the demographic groups most similar to Bahamians are Liberian (2.6%, a difference of 0.040%), Vietnamese (2.6%, a difference of 0.040%), Bermudan (2.6%, a difference of 0.070%), Albanian (2.6%, a difference of 0.090%), and Immigrants from Guatemala (2.6%, a difference of 0.11%).
| Demographics | Rating | Rank | Self-Care Disability |
| Guatemalans | 2.7 /100 | #228 | Tragic 2.6% |
| Guamanians/Chamorros | 2.5 /100 | #229 | Tragic 2.6% |
| Immigrants | Ecuador | 2.5 /100 | #230 | Tragic 2.6% |
| Immigrants | Guatemala | 2.2 /100 | #231 | Tragic 2.6% |
| Albanians | 2.2 /100 | #232 | Tragic 2.6% |
| Liberians | 2.1 /100 | #233 | Tragic 2.6% |
| Vietnamese | 2.1 /100 | #234 | Tragic 2.6% |
| Bahamians | 2.0 /100 | #235 | Tragic 2.6% |
| Bermudans | 1.9 /100 | #236 | Tragic 2.6% |
| Immigrants | Senegal | 1.6 /100 | #237 | Tragic 2.6% |
| Senegalese | 1.3 /100 | #238 | Tragic 2.6% |
| Immigrants | Panama | 1.2 /100 | #239 | Tragic 2.6% |
| Marshallese | 1.2 /100 | #240 | Tragic 2.6% |
| Immigrants | Syria | 1.0 /100 | #241 | Tragic 2.6% |
| Spanish | 0.8 /100 | #242 | Tragic 2.6% |
Demographics Similar to Immigrants from Austria by Self-Care Disability
In terms of self-care disability, the demographic groups most similar to Immigrants from Austria are Polish (2.4%, a difference of 0.020%), Immigrants from Romania (2.4%, a difference of 0.030%), Immigrants from South America (2.4%, a difference of 0.030%), Immigrants from Colombia (2.4%, a difference of 0.060%), and Colombian (2.4%, a difference of 0.080%).
| Demographics | Rating | Rank | Self-Care Disability |
| Immigrants | Nigeria | 90.3 /100 | #123 | Exceptional 2.4% |
| Immigrants | Morocco | 90.2 /100 | #124 | Exceptional 2.4% |
| Immigrants | North America | 90.2 /100 | #124 | Exceptional 2.4% |
| Hmong | 89.9 /100 | #126 | Excellent 2.4% |
| Colombians | 89.7 /100 | #127 | Excellent 2.4% |
| Immigrants | Hungary | 89.6 /100 | #128 | Excellent 2.4% |
| Immigrants | Romania | 89.3 /100 | #129 | Excellent 2.4% |
| Immigrants | Austria | 89.0 /100 | #130 | Excellent 2.4% |
| Poles | 88.9 /100 | #131 | Excellent 2.4% |
| Immigrants | South America | 88.8 /100 | #132 | Excellent 2.4% |
| Immigrants | Colombia | 88.5 /100 | #133 | Excellent 2.4% |
| Russians | 88.2 /100 | #134 | Excellent 2.4% |
| Laotians | 87.8 /100 | #135 | Excellent 2.4% |
| South American Indians | 87.2 /100 | #136 | Excellent 2.4% |
| Austrians | 87.0 /100 | #137 | Excellent 2.4% |