Bahamian vs Macedonian Family Households with Children
COMPARE
Bahamian
Macedonian
Family Households with Children
Family Households with Children Comparison
Bahamians
Macedonians
26.5%
FAMILY HOUSEHOLDS WITH CHILDREN
0.2/ 100
METRIC RATING
291st/ 347
METRIC RANK
26.4%
FAMILY HOUSEHOLDS WITH CHILDREN
0.1/ 100
METRIC RATING
295th/ 347
METRIC RANK
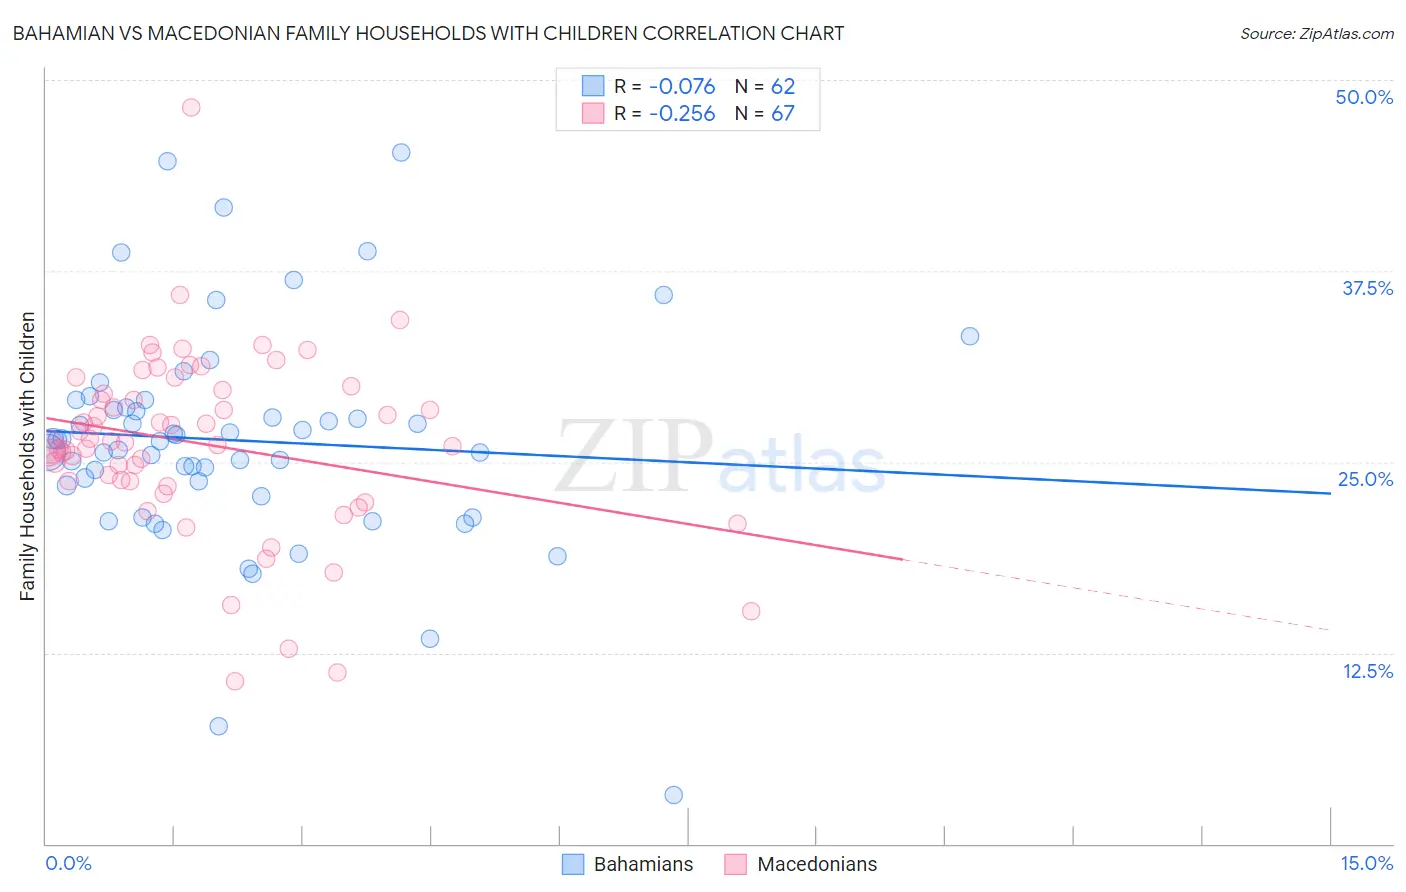
Bahamian vs Macedonian Family Households with Children Correlation Chart
The statistical analysis conducted on geographies consisting of 112,612,405 people shows a slight negative correlation between the proportion of Bahamians and percentage of family households with children in the United States with a correlation coefficient (R) of -0.076 and weighted average of 26.5%. Similarly, the statistical analysis conducted on geographies consisting of 132,577,245 people shows a weak negative correlation between the proportion of Macedonians and percentage of family households with children in the United States with a correlation coefficient (R) of -0.256 and weighted average of 26.4%, a difference of 0.19%.
Family Households with Children Correlation Summary
| Measurement | Bahamian | Macedonian |
| Minimum | 3.2% | 10.7% |
| Maximum | 45.3% | 48.2% |
| Range | 42.1% | 37.5% |
| Mean | 26.4% | 26.2% |
| Median | 26.4% | 26.2% |
| Interquartile 25% (IQ1) | 23.5% | 23.7% |
| Interquartile 75% (IQ3) | 28.6% | 29.7% |
| Interquartile Range (IQR) | 5.1% | 6.0% |
| Standard Deviation (Sample) | 7.3% | 5.9% |
| Standard Deviation (Population) | 7.2% | 5.9% |
Demographics Similar to Bahamians and Macedonians by Family Households with Children
In terms of family households with children, the demographic groups most similar to Bahamians are Albanian (26.5%, a difference of 0.010%), Polish (26.5%, a difference of 0.010%), Black/African American (26.5%, a difference of 0.060%), Immigrants from Sweden (26.5%, a difference of 0.12%), and Latvian (26.4%, a difference of 0.12%). Similarly, the demographic groups most similar to Macedonians are Croatian (26.4%, a difference of 0.020%), Armenian (26.4%, a difference of 0.030%), Latvian (26.4%, a difference of 0.080%), Black/African American (26.5%, a difference of 0.13%), and Immigrants from Western Europe (26.4%, a difference of 0.13%).
| Demographics | Rating | Rank | Family Households with Children |
| Immigrants | North America | 0.3 /100 | #283 | Tragic 26.6% |
| Immigrants | Canada | 0.3 /100 | #284 | Tragic 26.5% |
| Cambodians | 0.2 /100 | #285 | Tragic 26.5% |
| Immigrants | Senegal | 0.2 /100 | #286 | Tragic 26.5% |
| Shoshone | 0.2 /100 | #287 | Tragic 26.5% |
| Russians | 0.2 /100 | #288 | Tragic 26.5% |
| Immigrants | Sweden | 0.2 /100 | #289 | Tragic 26.5% |
| Albanians | 0.2 /100 | #290 | Tragic 26.5% |
| Bahamians | 0.2 /100 | #291 | Tragic 26.5% |
| Poles | 0.2 /100 | #292 | Tragic 26.5% |
| Blacks/African Americans | 0.1 /100 | #293 | Tragic 26.5% |
| Latvians | 0.1 /100 | #294 | Tragic 26.4% |
| Macedonians | 0.1 /100 | #295 | Tragic 26.4% |
| Croatians | 0.1 /100 | #296 | Tragic 26.4% |
| Armenians | 0.1 /100 | #297 | Tragic 26.4% |
| Immigrants | Western Europe | 0.1 /100 | #298 | Tragic 26.4% |
| Trinidadians and Tobagonians | 0.1 /100 | #299 | Tragic 26.4% |
| Paiute | 0.1 /100 | #300 | Tragic 26.4% |
| Immigrants | Trinidad and Tobago | 0.1 /100 | #301 | Tragic 26.4% |
| Serbians | 0.1 /100 | #302 | Tragic 26.4% |
| Immigrants | Guyana | 0.1 /100 | #303 | Tragic 26.3% |