Seminole vs Immigrants from West Indies Female Disability
COMPARE
Seminole
Immigrants from West Indies
Female Disability
Female Disability Comparison
Seminole
Immigrants from West Indies
15.0%
FEMALE DISABILITY
0.0/ 100
METRIC RATING
336th/ 347
METRIC RANK
12.6%
FEMALE DISABILITY
4.4/ 100
METRIC RATING
236th/ 347
METRIC RANK
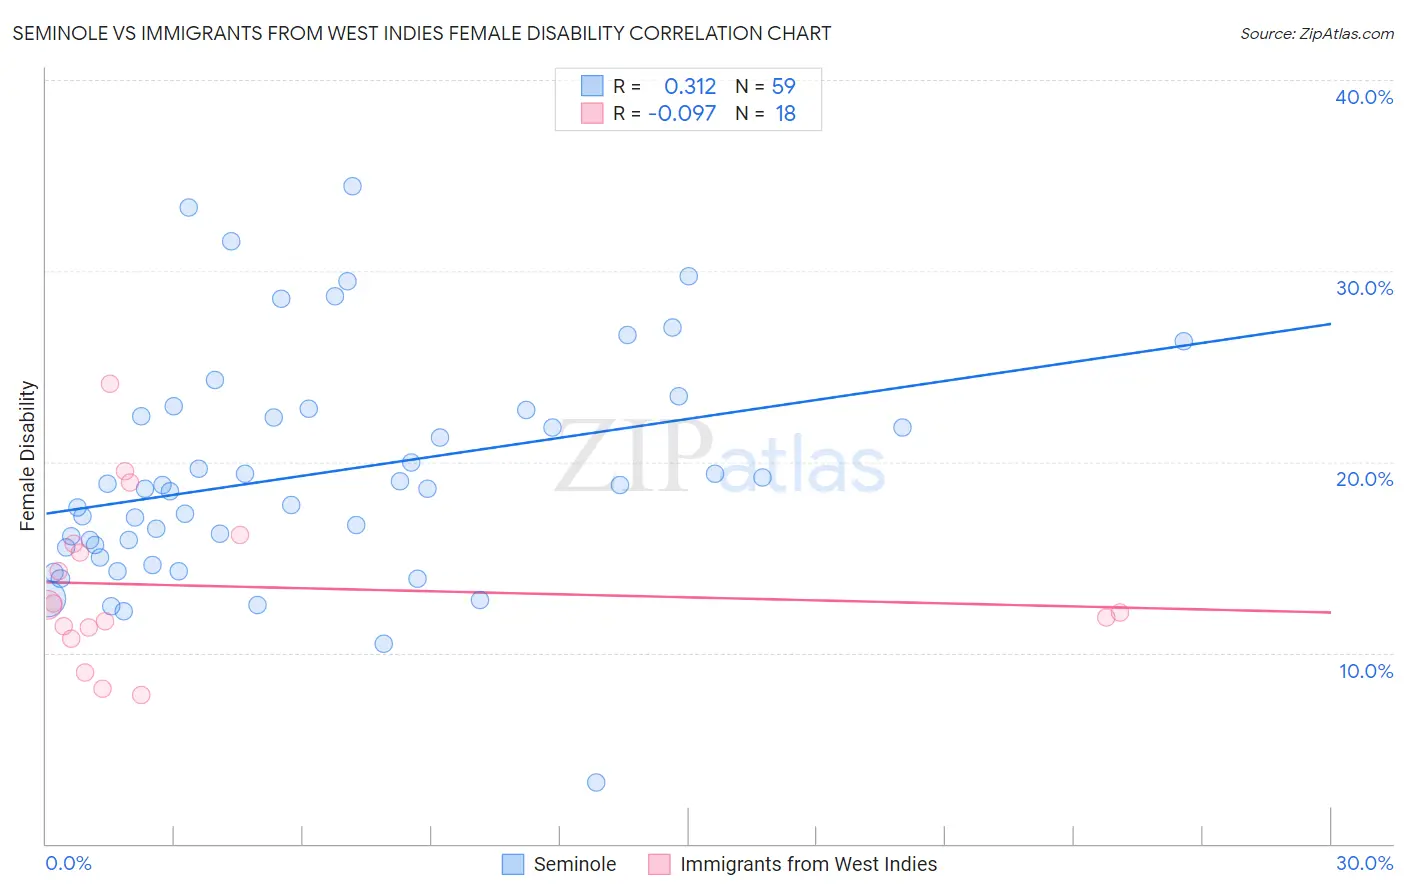
Seminole vs Immigrants from West Indies Female Disability Correlation Chart
The statistical analysis conducted on geographies consisting of 118,309,192 people shows a mild positive correlation between the proportion of Seminole and percentage of females with a disability in the United States with a correlation coefficient (R) of 0.312 and weighted average of 15.0%. Similarly, the statistical analysis conducted on geographies consisting of 72,456,124 people shows a slight negative correlation between the proportion of Immigrants from West Indies and percentage of females with a disability in the United States with a correlation coefficient (R) of -0.097 and weighted average of 12.6%, a difference of 19.3%.
Female Disability Correlation Summary
| Measurement | Seminole | Immigrants from West Indies |
| Minimum | 3.2% | 7.8% |
| Maximum | 34.4% | 24.1% |
| Range | 31.3% | 16.3% |
| Mean | 19.4% | 13.5% |
| Median | 18.6% | 12.3% |
| Interquartile 25% (IQ1) | 15.5% | 11.3% |
| Interquartile 75% (IQ3) | 22.7% | 15.7% |
| Interquartile Range (IQR) | 7.2% | 4.4% |
| Standard Deviation (Sample) | 6.0% | 4.2% |
| Standard Deviation (Population) | 6.0% | 4.1% |
Similar Demographics by Female Disability
Demographics Similar to Seminole by Female Disability
In terms of female disability, the demographic groups most similar to Seminole are Tohono O'odham (15.0%, a difference of 0.12%), Dutch West Indian (15.0%, a difference of 0.26%), Cajun (14.9%, a difference of 0.67%), Colville (15.1%, a difference of 0.67%), and Cherokee (14.9%, a difference of 0.69%).
| Demographics | Rating | Rank | Female Disability |
| Osage | 0.0 /100 | #329 | Tragic 14.3% |
| Yuman | 0.0 /100 | #330 | Tragic 14.5% |
| Immigrants | Cabo Verde | 0.0 /100 | #331 | Tragic 14.6% |
| Pima | 0.0 /100 | #332 | Tragic 14.8% |
| Immigrants | Azores | 0.0 /100 | #333 | Tragic 14.9% |
| Cherokee | 0.0 /100 | #334 | Tragic 14.9% |
| Cajuns | 0.0 /100 | #335 | Tragic 14.9% |
| Seminole | 0.0 /100 | #336 | Tragic 15.0% |
| Tohono O'odham | 0.0 /100 | #337 | Tragic 15.0% |
| Dutch West Indians | 0.0 /100 | #338 | Tragic 15.0% |
| Colville | 0.0 /100 | #339 | Tragic 15.1% |
| Chickasaw | 0.0 /100 | #340 | Tragic 15.2% |
| Choctaw | 0.0 /100 | #341 | Tragic 15.4% |
| Creek | 0.0 /100 | #342 | Tragic 15.7% |
| Lumbee | 0.0 /100 | #343 | Tragic 15.8% |
Demographics Similar to Immigrants from West Indies by Female Disability
In terms of female disability, the demographic groups most similar to Immigrants from West Indies are Malaysian (12.5%, a difference of 0.13%), Slavic (12.6%, a difference of 0.13%), Yugoslavian (12.6%, a difference of 0.15%), Scandinavian (12.5%, a difference of 0.18%), and Immigrants from Iraq (12.5%, a difference of 0.19%).
| Demographics | Rating | Rank | Female Disability |
| Hungarians | 7.2 /100 | #229 | Tragic 12.5% |
| Immigrants | Belize | 7.0 /100 | #230 | Tragic 12.5% |
| Belgians | 6.5 /100 | #231 | Tragic 12.5% |
| Immigrants | Somalia | 5.9 /100 | #232 | Tragic 12.5% |
| Immigrants | Iraq | 5.3 /100 | #233 | Tragic 12.5% |
| Scandinavians | 5.3 /100 | #234 | Tragic 12.5% |
| Malaysians | 5.0 /100 | #235 | Tragic 12.5% |
| Immigrants | West Indies | 4.4 /100 | #236 | Tragic 12.6% |
| Slavs | 3.8 /100 | #237 | Tragic 12.6% |
| Yugoslavians | 3.7 /100 | #238 | Tragic 12.6% |
| Barbadians | 3.6 /100 | #239 | Tragic 12.6% |
| German Russians | 3.2 /100 | #240 | Tragic 12.6% |
| Japanese | 2.7 /100 | #241 | Tragic 12.6% |
| Canadians | 2.6 /100 | #242 | Tragic 12.6% |
| Immigrants | Senegal | 2.5 /100 | #243 | Tragic 12.6% |