Austrian vs Guamanian/Chamorro Female Disability
COMPARE
Austrian
Guamanian/Chamorro
Female Disability
Female Disability Comparison
Austrians
Guamanians/Chamorros
12.3%
FEMALE DISABILITY
33.3/ 100
METRIC RATING
186th/ 347
METRIC RANK
12.5%
FEMALE DISABILITY
9.5/ 100
METRIC RATING
223rd/ 347
METRIC RANK
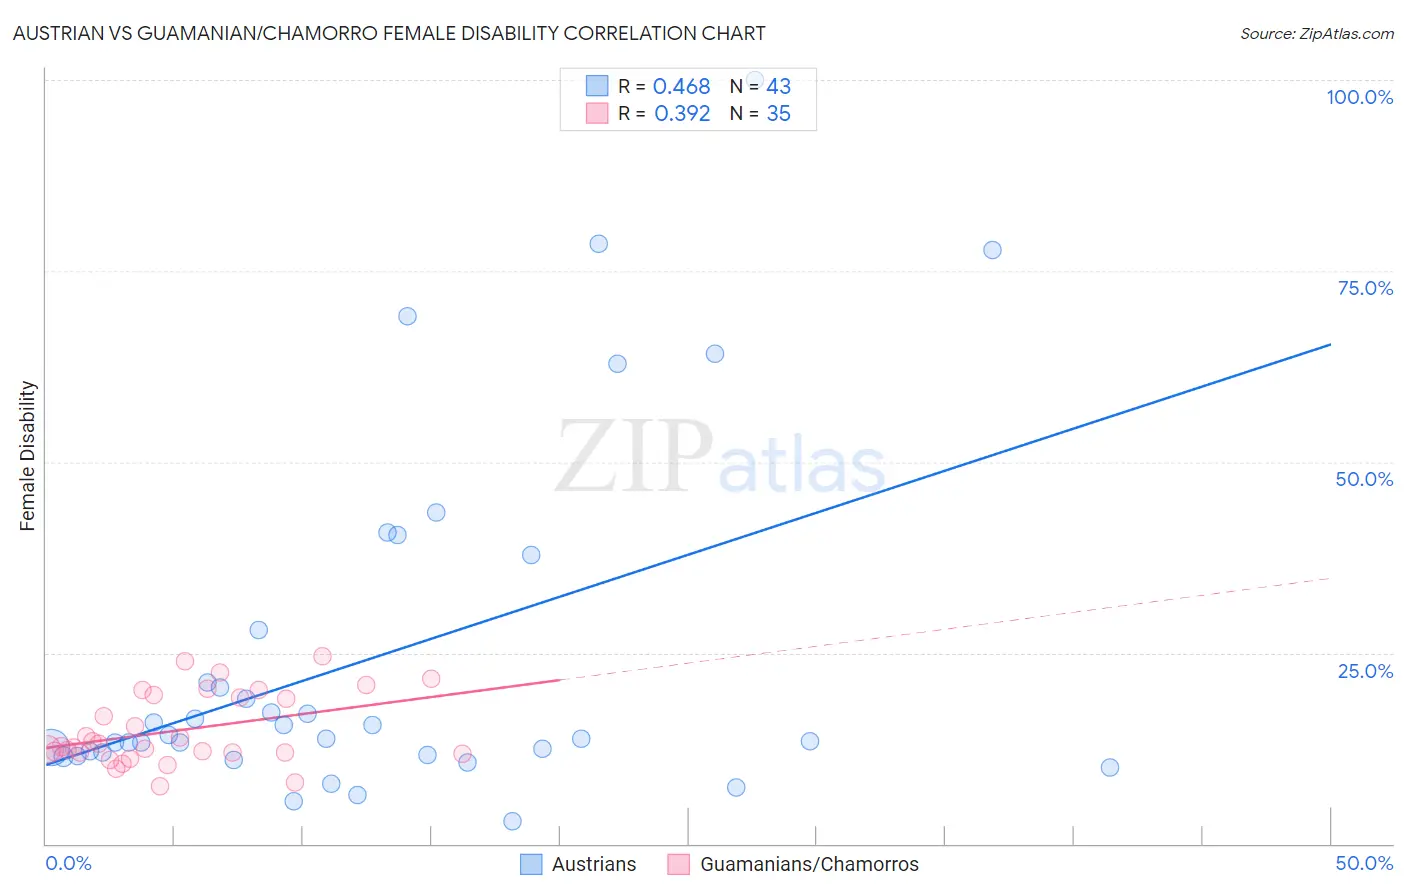
Austrian vs Guamanian/Chamorro Female Disability Correlation Chart
The statistical analysis conducted on geographies consisting of 452,021,932 people shows a moderate positive correlation between the proportion of Austrians and percentage of females with a disability in the United States with a correlation coefficient (R) of 0.468 and weighted average of 12.3%. Similarly, the statistical analysis conducted on geographies consisting of 221,879,045 people shows a mild positive correlation between the proportion of Guamanians/Chamorros and percentage of females with a disability in the United States with a correlation coefficient (R) of 0.392 and weighted average of 12.5%, a difference of 1.5%.
Female Disability Correlation Summary
| Measurement | Austrian | Guamanian/Chamorro |
| Minimum | 2.9% | 7.5% |
| Maximum | 100.0% | 24.6% |
| Range | 97.1% | 17.1% |
| Mean | 24.5% | 14.9% |
| Median | 13.7% | 12.7% |
| Interquartile 25% (IQ1) | 11.6% | 11.9% |
| Interquartile 75% (IQ3) | 28.0% | 19.5% |
| Interquartile Range (IQR) | 16.3% | 7.6% |
| Standard Deviation (Sample) | 23.1% | 4.7% |
| Standard Deviation (Population) | 22.8% | 4.6% |
Similar Demographics by Female Disability
Demographics Similar to Austrians by Female Disability
In terms of female disability, the demographic groups most similar to Austrians are Serbian (12.3%, a difference of 0.010%), Immigrants from Uzbekistan (12.3%, a difference of 0.020%), Immigrants from North America (12.3%, a difference of 0.020%), Immigrants from Albania (12.3%, a difference of 0.080%), and Immigrants from Honduras (12.3%, a difference of 0.090%).
| Demographics | Rating | Rank | Female Disability |
| Immigrants | Fiji | 38.2 /100 | #179 | Fair 12.3% |
| Albanians | 37.9 /100 | #180 | Fair 12.3% |
| Immigrants | Canada | 37.2 /100 | #181 | Fair 12.3% |
| Norwegians | 36.9 /100 | #182 | Fair 12.3% |
| Cubans | 36.5 /100 | #183 | Fair 12.3% |
| Iraqis | 36.0 /100 | #184 | Fair 12.3% |
| Immigrants | Uzbekistan | 33.9 /100 | #185 | Fair 12.3% |
| Austrians | 33.3 /100 | #186 | Fair 12.3% |
| Serbians | 33.1 /100 | #187 | Fair 12.3% |
| Immigrants | North America | 32.8 /100 | #188 | Fair 12.3% |
| Immigrants | Albania | 31.6 /100 | #189 | Fair 12.3% |
| Immigrants | Honduras | 31.3 /100 | #190 | Fair 12.3% |
| Armenians | 29.7 /100 | #191 | Fair 12.3% |
| Immigrants | Western Africa | 29.2 /100 | #192 | Fair 12.3% |
| Northern Europeans | 27.5 /100 | #193 | Fair 12.3% |
Demographics Similar to Guamanians/Chamorros by Female Disability
In terms of female disability, the demographic groups most similar to Guamanians/Chamorros are Belizean (12.5%, a difference of 0.020%), Polish (12.5%, a difference of 0.12%), Italian (12.4%, a difference of 0.13%), Native Hawaiian (12.4%, a difference of 0.14%), and Bahamian (12.4%, a difference of 0.16%).
| Demographics | Rating | Rank | Female Disability |
| Immigrants | Burma/Myanmar | 13.3 /100 | #216 | Poor 12.4% |
| British | 12.7 /100 | #217 | Poor 12.4% |
| Immigrants | Bahamas | 12.5 /100 | #218 | Poor 12.4% |
| Europeans | 12.1 /100 | #219 | Poor 12.4% |
| Bahamians | 11.1 /100 | #220 | Poor 12.4% |
| Native Hawaiians | 10.8 /100 | #221 | Poor 12.4% |
| Italians | 10.7 /100 | #222 | Poor 12.4% |
| Guamanians/Chamorros | 9.5 /100 | #223 | Tragic 12.5% |
| Belizeans | 9.3 /100 | #224 | Tragic 12.5% |
| Poles | 8.4 /100 | #225 | Tragic 12.5% |
| Hispanics or Latinos | 8.0 /100 | #226 | Tragic 12.5% |
| Assyrians/Chaldeans/Syriacs | 8.0 /100 | #227 | Tragic 12.5% |
| Immigrants | Cambodia | 7.8 /100 | #228 | Tragic 12.5% |
| Hungarians | 7.2 /100 | #229 | Tragic 12.5% |
| Immigrants | Belize | 7.0 /100 | #230 | Tragic 12.5% |