Russian vs Immigrants from West Indies Female Disability
COMPARE
Russian
Immigrants from West Indies
Female Disability
Female Disability Comparison
Russians
Immigrants from West Indies
11.8%
FEMALE DISABILITY
96.5/ 100
METRIC RATING
124th/ 347
METRIC RANK
12.6%
FEMALE DISABILITY
4.4/ 100
METRIC RATING
236th/ 347
METRIC RANK
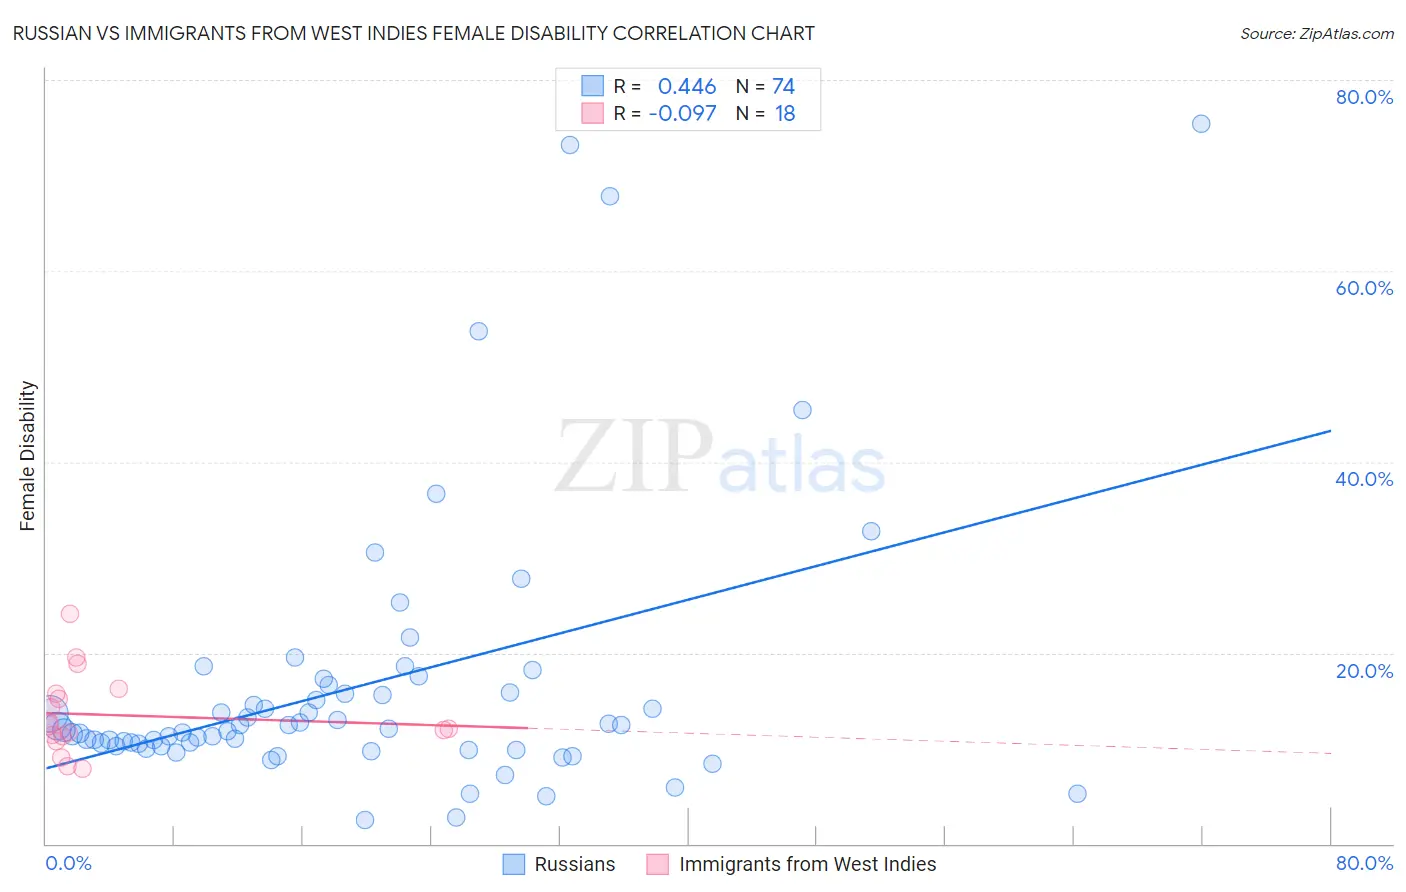
Russian vs Immigrants from West Indies Female Disability Correlation Chart
The statistical analysis conducted on geographies consisting of 512,105,615 people shows a moderate positive correlation between the proportion of Russians and percentage of females with a disability in the United States with a correlation coefficient (R) of 0.446 and weighted average of 11.8%. Similarly, the statistical analysis conducted on geographies consisting of 72,456,124 people shows a slight negative correlation between the proportion of Immigrants from West Indies and percentage of females with a disability in the United States with a correlation coefficient (R) of -0.097 and weighted average of 12.6%, a difference of 6.2%.
Female Disability Correlation Summary
| Measurement | Russian | Immigrants from West Indies |
| Minimum | 2.5% | 7.8% |
| Maximum | 75.4% | 24.1% |
| Range | 73.0% | 16.3% |
| Mean | 16.5% | 13.5% |
| Median | 12.0% | 12.3% |
| Interquartile 25% (IQ1) | 10.3% | 11.3% |
| Interquartile 75% (IQ3) | 15.8% | 15.7% |
| Interquartile Range (IQR) | 5.5% | 4.4% |
| Standard Deviation (Sample) | 14.3% | 4.2% |
| Standard Deviation (Population) | 14.2% | 4.1% |
Similar Demographics by Female Disability
Demographics Similar to Russians by Female Disability
In terms of female disability, the demographic groups most similar to Russians are Immigrants from Italy (11.8%, a difference of 0.030%), Immigrants from Croatia (11.8%, a difference of 0.050%), Immigrants from Europe (11.8%, a difference of 0.090%), Immigrants from North Macedonia (11.8%, a difference of 0.10%), and Immigrants from Netherlands (11.8%, a difference of 0.11%).
| Demographics | Rating | Rank | Female Disability |
| Immigrants | Eastern Europe | 97.2 /100 | #117 | Exceptional 11.8% |
| Immigrants | Nigeria | 97.2 /100 | #118 | Exceptional 11.8% |
| Immigrants | Uganda | 97.2 /100 | #119 | Exceptional 11.8% |
| Immigrants | Kazakhstan | 97.0 /100 | #120 | Exceptional 11.8% |
| Immigrants | Netherlands | 96.9 /100 | #121 | Exceptional 11.8% |
| Immigrants | North Macedonia | 96.8 /100 | #122 | Exceptional 11.8% |
| Immigrants | Croatia | 96.7 /100 | #123 | Exceptional 11.8% |
| Russians | 96.5 /100 | #124 | Exceptional 11.8% |
| Immigrants | Italy | 96.4 /100 | #125 | Exceptional 11.8% |
| Immigrants | Europe | 96.2 /100 | #126 | Exceptional 11.8% |
| South American Indians | 95.8 /100 | #127 | Exceptional 11.8% |
| Immigrants | Latvia | 95.6 /100 | #128 | Exceptional 11.8% |
| Macedonians | 95.5 /100 | #129 | Exceptional 11.8% |
| Nicaraguans | 95.2 /100 | #130 | Exceptional 11.9% |
| Arabs | 95.1 /100 | #131 | Exceptional 11.9% |
Demographics Similar to Immigrants from West Indies by Female Disability
In terms of female disability, the demographic groups most similar to Immigrants from West Indies are Malaysian (12.5%, a difference of 0.13%), Slavic (12.6%, a difference of 0.13%), Yugoslavian (12.6%, a difference of 0.15%), Scandinavian (12.5%, a difference of 0.18%), and Immigrants from Iraq (12.5%, a difference of 0.19%).
| Demographics | Rating | Rank | Female Disability |
| Hungarians | 7.2 /100 | #229 | Tragic 12.5% |
| Immigrants | Belize | 7.0 /100 | #230 | Tragic 12.5% |
| Belgians | 6.5 /100 | #231 | Tragic 12.5% |
| Immigrants | Somalia | 5.9 /100 | #232 | Tragic 12.5% |
| Immigrants | Iraq | 5.3 /100 | #233 | Tragic 12.5% |
| Scandinavians | 5.3 /100 | #234 | Tragic 12.5% |
| Malaysians | 5.0 /100 | #235 | Tragic 12.5% |
| Immigrants | West Indies | 4.4 /100 | #236 | Tragic 12.6% |
| Slavs | 3.8 /100 | #237 | Tragic 12.6% |
| Yugoslavians | 3.7 /100 | #238 | Tragic 12.6% |
| Barbadians | 3.6 /100 | #239 | Tragic 12.6% |
| German Russians | 3.2 /100 | #240 | Tragic 12.6% |
| Japanese | 2.7 /100 | #241 | Tragic 12.6% |
| Canadians | 2.6 /100 | #242 | Tragic 12.6% |
| Immigrants | Senegal | 2.5 /100 | #243 | Tragic 12.6% |