British West Indian vs Immigrants from West Indies Female Disability
COMPARE
British West Indian
Immigrants from West Indies
Female Disability
Female Disability Comparison
British West Indians
Immigrants from West Indies
12.7%
FEMALE DISABILITY
1.2/ 100
METRIC RATING
256th/ 347
METRIC RANK
12.6%
FEMALE DISABILITY
4.4/ 100
METRIC RATING
236th/ 347
METRIC RANK
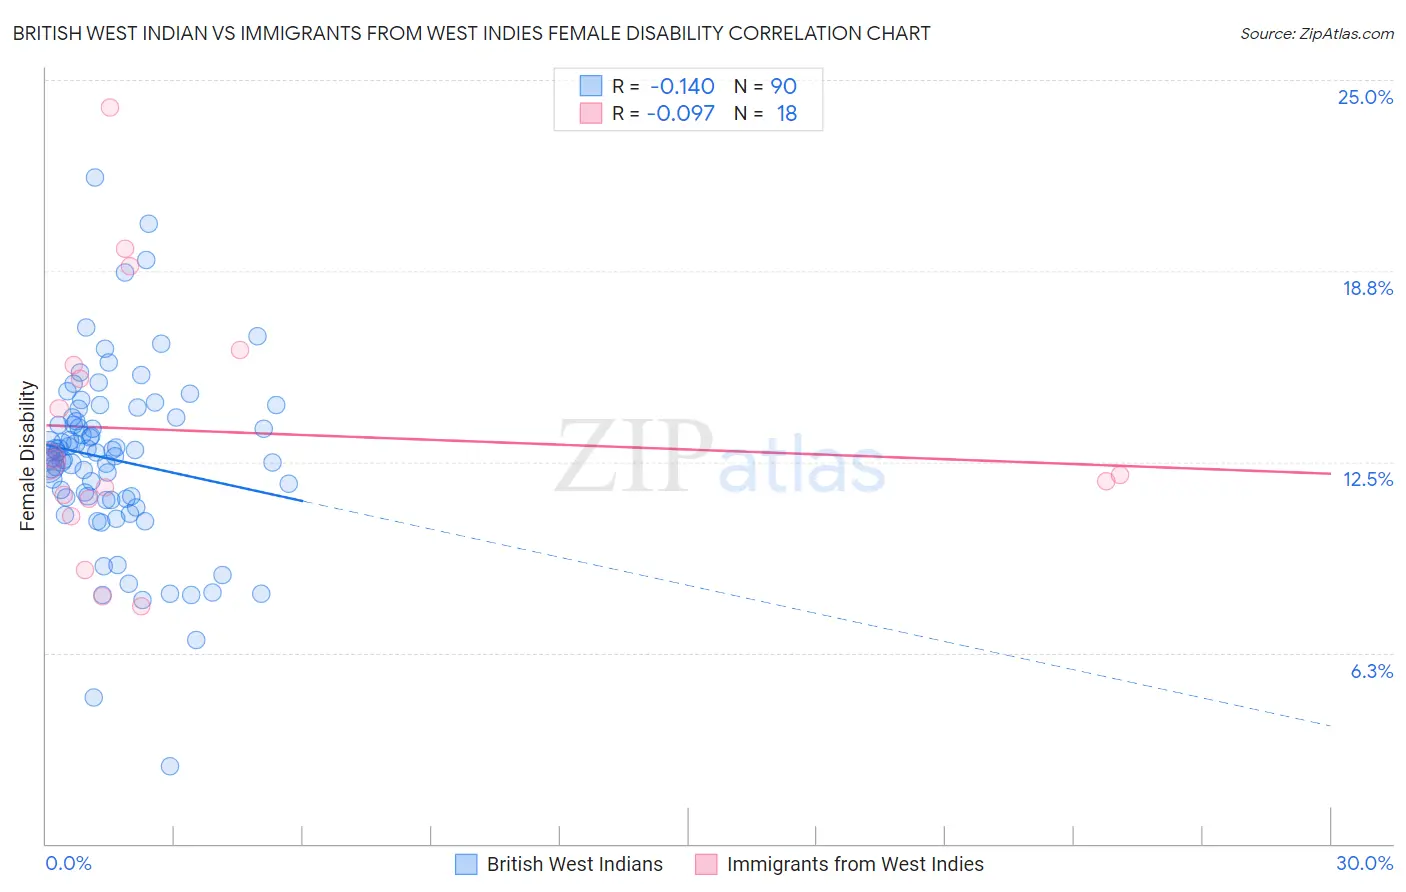
British West Indian vs Immigrants from West Indies Female Disability Correlation Chart
The statistical analysis conducted on geographies consisting of 152,669,776 people shows a poor negative correlation between the proportion of British West Indians and percentage of females with a disability in the United States with a correlation coefficient (R) of -0.140 and weighted average of 12.7%. Similarly, the statistical analysis conducted on geographies consisting of 72,456,124 people shows a slight negative correlation between the proportion of Immigrants from West Indies and percentage of females with a disability in the United States with a correlation coefficient (R) of -0.097 and weighted average of 12.6%, a difference of 1.2%.
Female Disability Correlation Summary
| Measurement | British West Indian | Immigrants from West Indies |
| Minimum | 2.5% | 7.8% |
| Maximum | 21.8% | 24.1% |
| Range | 19.2% | 16.3% |
| Mean | 12.6% | 13.5% |
| Median | 12.8% | 12.3% |
| Interquartile 25% (IQ1) | 11.3% | 11.3% |
| Interquartile 75% (IQ3) | 14.0% | 15.7% |
| Interquartile Range (IQR) | 2.7% | 4.4% |
| Standard Deviation (Sample) | 3.0% | 4.2% |
| Standard Deviation (Population) | 2.9% | 4.1% |
Demographics Similar to British West Indians and Immigrants from West Indies by Female Disability
In terms of female disability, the demographic groups most similar to British West Indians are Immigrants from Germany (12.7%, a difference of 0.070%), Hawaiian (12.7%, a difference of 0.15%), Jamaican (12.7%, a difference of 0.18%), Immigrants from Caribbean (12.7%, a difference of 0.20%), and Crow (12.7%, a difference of 0.28%). Similarly, the demographic groups most similar to Immigrants from West Indies are Slavic (12.6%, a difference of 0.13%), Yugoslavian (12.6%, a difference of 0.15%), Barbadian (12.6%, a difference of 0.19%), German Russian (12.6%, a difference of 0.28%), and Japanese (12.6%, a difference of 0.45%).
| Demographics | Rating | Rank | Female Disability |
| Immigrants | West Indies | 4.4 /100 | #236 | Tragic 12.6% |
| Slavs | 3.8 /100 | #237 | Tragic 12.6% |
| Yugoslavians | 3.7 /100 | #238 | Tragic 12.6% |
| Barbadians | 3.6 /100 | #239 | Tragic 12.6% |
| German Russians | 3.2 /100 | #240 | Tragic 12.6% |
| Japanese | 2.7 /100 | #241 | Tragic 12.6% |
| Canadians | 2.6 /100 | #242 | Tragic 12.6% |
| Immigrants | Senegal | 2.5 /100 | #243 | Tragic 12.6% |
| Alsatians | 2.5 /100 | #244 | Tragic 12.6% |
| Immigrants | Jamaica | 2.2 /100 | #245 | Tragic 12.6% |
| Spanish American Indians | 2.1 /100 | #246 | Tragic 12.6% |
| Menominee | 2.1 /100 | #247 | Tragic 12.6% |
| Carpatho Rusyns | 2.0 /100 | #248 | Tragic 12.6% |
| Immigrants | Congo | 1.8 /100 | #249 | Tragic 12.7% |
| Slovenes | 1.7 /100 | #250 | Tragic 12.7% |
| Crow | 1.6 /100 | #251 | Tragic 12.7% |
| Immigrants | Caribbean | 1.4 /100 | #252 | Tragic 12.7% |
| Jamaicans | 1.4 /100 | #253 | Tragic 12.7% |
| Hawaiians | 1.4 /100 | #254 | Tragic 12.7% |
| Immigrants | Germany | 1.3 /100 | #255 | Tragic 12.7% |
| British West Indians | 1.2 /100 | #256 | Tragic 12.7% |