Assyrian/Chaldean/Syriac vs Tsimshian Disability Age Over 75
COMPARE
Assyrian/Chaldean/Syriac
Tsimshian
Disability Age Over 75
Disability Age Over 75 Comparison
Assyrians/Chaldeans/Syriacs
Tsimshian
49.1%
DISABILITY AGE OVER 75
0.2/ 100
METRIC RATING
272nd/ 347
METRIC RANK
59.2%
DISABILITY AGE OVER 75
0.0/ 100
METRIC RATING
346th/ 347
METRIC RANK
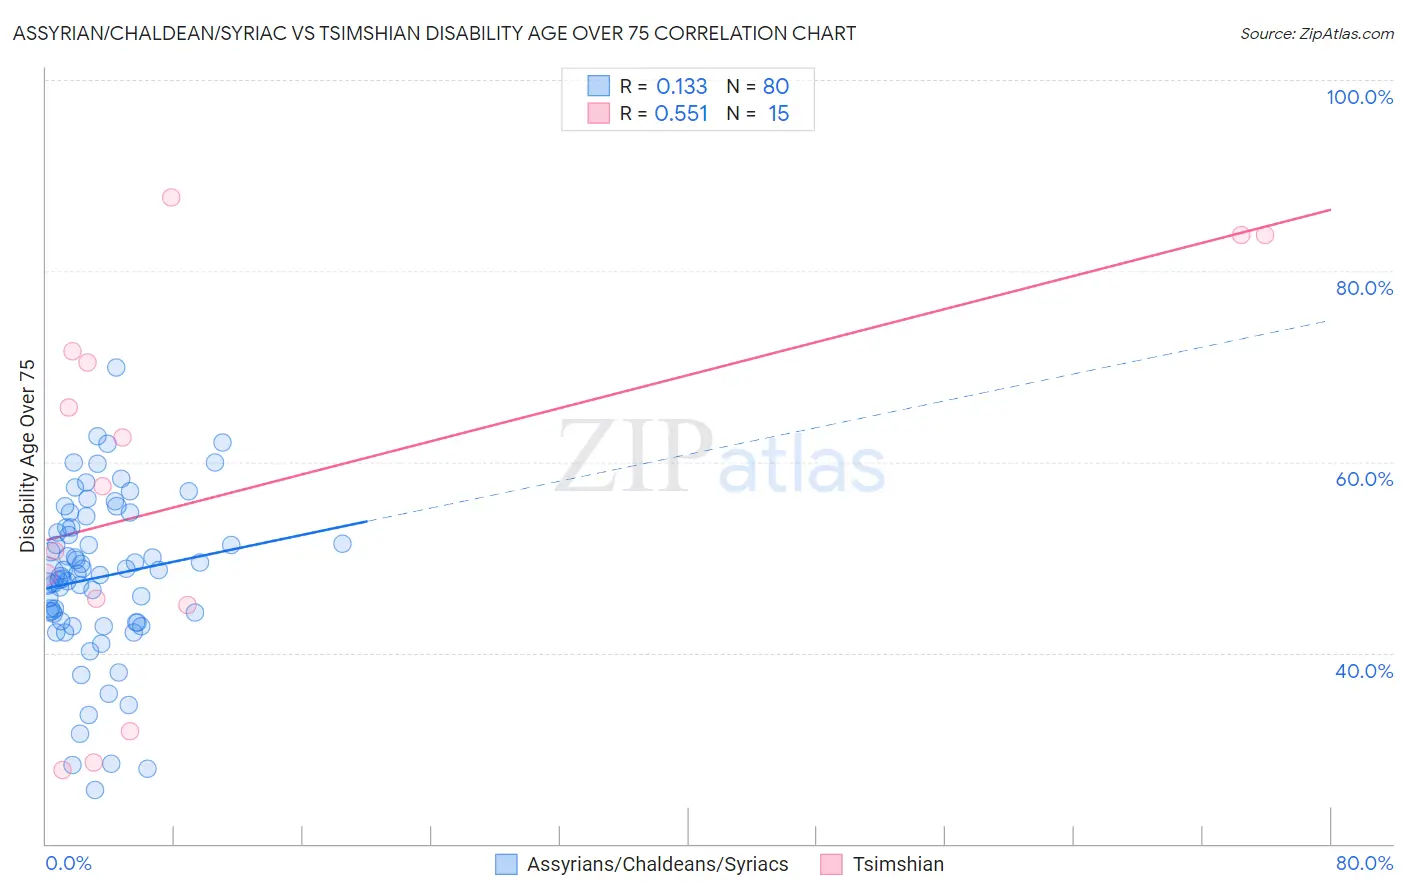
Assyrian/Chaldean/Syriac vs Tsimshian Disability Age Over 75 Correlation Chart
The statistical analysis conducted on geographies consisting of 110,272,420 people shows a poor positive correlation between the proportion of Assyrians/Chaldeans/Syriacs and percentage of population with a disability over the age of 75 in the United States with a correlation coefficient (R) of 0.133 and weighted average of 49.1%. Similarly, the statistical analysis conducted on geographies consisting of 15,620,176 people shows a substantial positive correlation between the proportion of Tsimshian and percentage of population with a disability over the age of 75 in the United States with a correlation coefficient (R) of 0.551 and weighted average of 59.2%, a difference of 20.7%.
Disability Age Over 75 Correlation Summary
| Measurement | Assyrian/Chaldean/Syriac | Tsimshian |
| Minimum | 25.6% | 27.7% |
| Maximum | 69.9% | 87.8% |
| Range | 44.3% | 60.1% |
| Mean | 47.9% | 57.4% |
| Median | 48.2% | 57.4% |
| Interquartile 25% (IQ1) | 43.3% | 45.0% |
| Interquartile 75% (IQ3) | 53.1% | 71.6% |
| Interquartile Range (IQR) | 9.9% | 26.6% |
| Standard Deviation (Sample) | 8.5% | 20.0% |
| Standard Deviation (Population) | 8.4% | 19.3% |
Similar Demographics by Disability Age Over 75
Demographics Similar to Assyrians/Chaldeans/Syriacs by Disability Age Over 75
In terms of disability age over 75, the demographic groups most similar to Assyrians/Chaldeans/Syriacs are Fijian (49.0%, a difference of 0.010%), Potawatomi (49.0%, a difference of 0.030%), Immigrants from Iraq (49.1%, a difference of 0.050%), Immigrants from El Salvador (49.0%, a difference of 0.060%), and Guatemalan (49.0%, a difference of 0.080%).
| Demographics | Rating | Rank | Disability Age Over 75 |
| Hondurans | 0.3 /100 | #265 | Tragic 48.9% |
| U.S. Virgin Islanders | 0.2 /100 | #266 | Tragic 48.9% |
| Malaysians | 0.2 /100 | #267 | Tragic 49.0% |
| Guatemalans | 0.2 /100 | #268 | Tragic 49.0% |
| Immigrants | El Salvador | 0.2 /100 | #269 | Tragic 49.0% |
| Potawatomi | 0.2 /100 | #270 | Tragic 49.0% |
| Fijians | 0.2 /100 | #271 | Tragic 49.0% |
| Assyrians/Chaldeans/Syriacs | 0.2 /100 | #272 | Tragic 49.1% |
| Immigrants | Iraq | 0.1 /100 | #273 | Tragic 49.1% |
| Immigrants | Guatemala | 0.1 /100 | #274 | Tragic 49.1% |
| Immigrants | Dominica | 0.1 /100 | #275 | Tragic 49.1% |
| Immigrants | Uzbekistan | 0.1 /100 | #276 | Tragic 49.2% |
| Hawaiians | 0.1 /100 | #277 | Tragic 49.2% |
| Immigrants | Laos | 0.1 /100 | #278 | Tragic 49.2% |
| Guamanians/Chamorros | 0.0 /100 | #279 | Tragic 49.4% |
Demographics Similar to Tsimshian by Disability Age Over 75
In terms of disability age over 75, the demographic groups most similar to Tsimshian are Inupiat (58.4%, a difference of 1.4%), Navajo (58.3%, a difference of 1.6%), Yup'ik (61.1%, a difference of 3.2%), Tohono O'odham (56.7%, a difference of 4.4%), and Lumbee (56.2%, a difference of 5.3%).
| Demographics | Rating | Rank | Disability Age Over 75 |
| Apache | 0.0 /100 | #333 | Tragic 53.6% |
| Alaskan Athabascans | 0.0 /100 | #334 | Tragic 54.0% |
| Kiowa | 0.0 /100 | #335 | Tragic 54.2% |
| Immigrants | Armenia | 0.0 /100 | #336 | Tragic 54.3% |
| Yuman | 0.0 /100 | #337 | Tragic 54.4% |
| Colville | 0.0 /100 | #338 | Tragic 55.4% |
| Pima | 0.0 /100 | #339 | Tragic 55.8% |
| Pueblo | 0.0 /100 | #340 | Tragic 55.9% |
| Houma | 0.0 /100 | #341 | Tragic 56.2% |
| Lumbee | 0.0 /100 | #342 | Tragic 56.2% |
| Tohono O'odham | 0.0 /100 | #343 | Tragic 56.7% |
| Navajo | 0.0 /100 | #344 | Tragic 58.3% |
| Inupiat | 0.0 /100 | #345 | Tragic 58.4% |
| Tsimshian | 0.0 /100 | #346 | Tragic 59.2% |
| Yup'ik | 0.0 /100 | #347 | Tragic 61.1% |