Portuguese vs Tsimshian Disability Age Over 75
COMPARE
Portuguese
Tsimshian
Disability Age Over 75
Disability Age Over 75 Comparison
Portuguese
Tsimshian
47.6%
DISABILITY AGE OVER 75
29.3/ 100
METRIC RATING
191st/ 347
METRIC RANK
59.2%
DISABILITY AGE OVER 75
0.0/ 100
METRIC RATING
346th/ 347
METRIC RANK
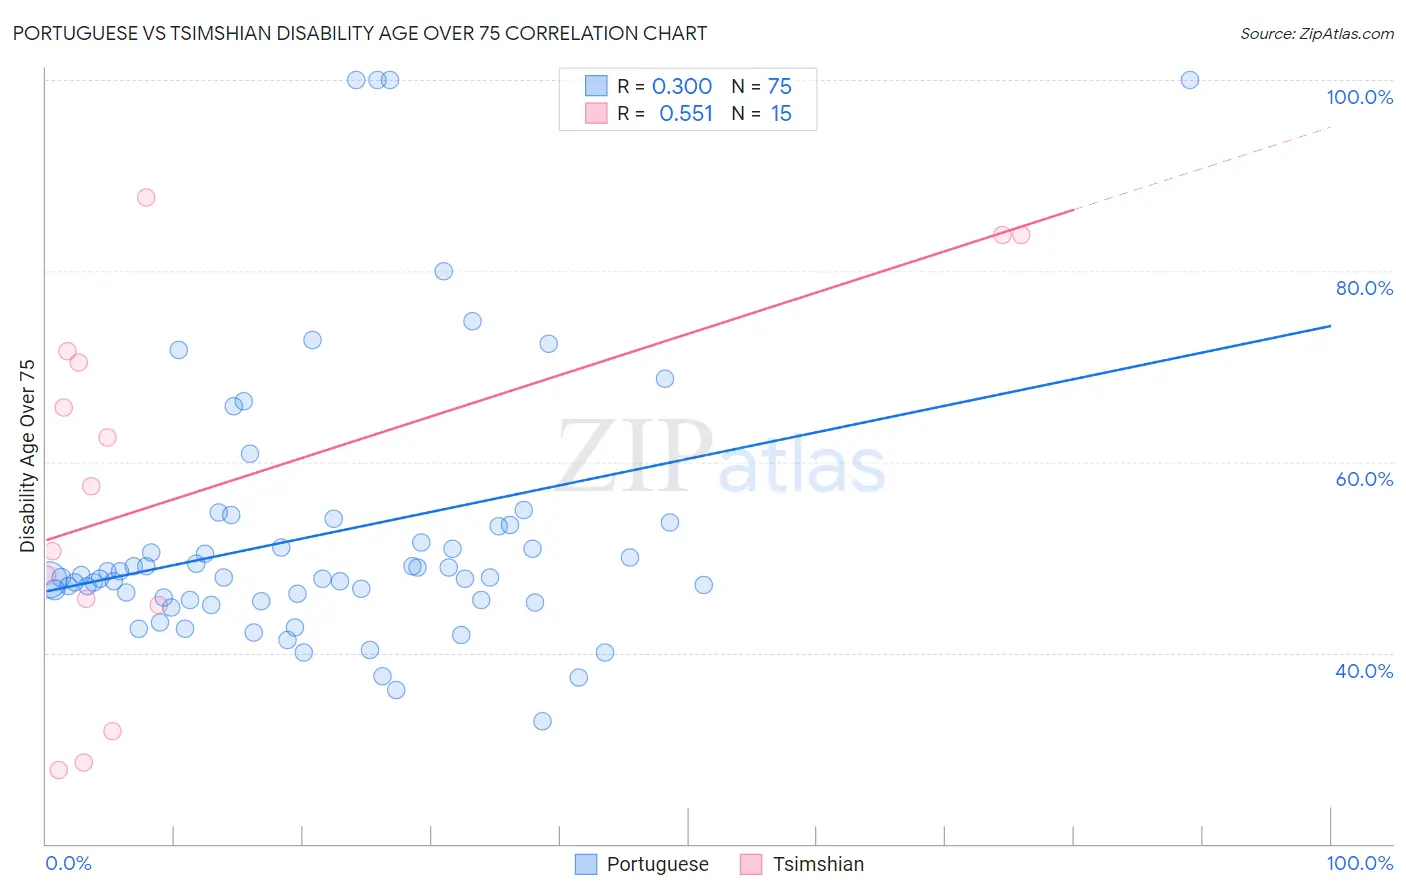
Portuguese vs Tsimshian Disability Age Over 75 Correlation Chart
The statistical analysis conducted on geographies consisting of 449,198,171 people shows a mild positive correlation between the proportion of Portuguese and percentage of population with a disability over the age of 75 in the United States with a correlation coefficient (R) of 0.300 and weighted average of 47.6%. Similarly, the statistical analysis conducted on geographies consisting of 15,620,176 people shows a substantial positive correlation between the proportion of Tsimshian and percentage of population with a disability over the age of 75 in the United States with a correlation coefficient (R) of 0.551 and weighted average of 59.2%, a difference of 24.4%.
Disability Age Over 75 Correlation Summary
| Measurement | Portuguese | Tsimshian |
| Minimum | 32.8% | 27.7% |
| Maximum | 100.0% | 87.8% |
| Range | 67.2% | 60.1% |
| Mean | 52.5% | 57.4% |
| Median | 47.9% | 57.4% |
| Interquartile 25% (IQ1) | 45.5% | 45.0% |
| Interquartile 75% (IQ3) | 53.3% | 71.6% |
| Interquartile Range (IQR) | 7.8% | 26.6% |
| Standard Deviation (Sample) | 14.5% | 20.0% |
| Standard Deviation (Population) | 14.4% | 19.3% |
Similar Demographics by Disability Age Over 75
Demographics Similar to Portuguese by Disability Age Over 75
In terms of disability age over 75, the demographic groups most similar to Portuguese are Somali (47.6%, a difference of 0.010%), Immigrants from Jamaica (47.6%, a difference of 0.030%), Ottawa (47.6%, a difference of 0.030%), Basque (47.6%, a difference of 0.040%), and Immigrants from Kenya (47.6%, a difference of 0.040%).
| Demographics | Rating | Rank | Disability Age Over 75 |
| Immigrants | Nigeria | 34.0 /100 | #184 | Fair 47.5% |
| Ghanaians | 33.0 /100 | #185 | Fair 47.5% |
| Sudanese | 32.0 /100 | #186 | Fair 47.5% |
| Immigrants | Sudan | 31.8 /100 | #187 | Fair 47.5% |
| Basques | 30.9 /100 | #188 | Fair 47.6% |
| Immigrants | Kenya | 30.8 /100 | #189 | Fair 47.6% |
| Somalis | 29.5 /100 | #190 | Fair 47.6% |
| Portuguese | 29.3 /100 | #191 | Fair 47.6% |
| Immigrants | Jamaica | 28.3 /100 | #192 | Fair 47.6% |
| Ottawa | 28.1 /100 | #193 | Fair 47.6% |
| Immigrants | Lebanon | 26.5 /100 | #194 | Fair 47.6% |
| Immigrants | Trinidad and Tobago | 25.3 /100 | #195 | Fair 47.6% |
| Immigrants | Portugal | 23.8 /100 | #196 | Fair 47.6% |
| Pakistanis | 23.4 /100 | #197 | Fair 47.7% |
| Immigrants | Ukraine | 23.2 /100 | #198 | Fair 47.7% |
Demographics Similar to Tsimshian by Disability Age Over 75
In terms of disability age over 75, the demographic groups most similar to Tsimshian are Inupiat (58.4%, a difference of 1.4%), Navajo (58.3%, a difference of 1.6%), Yup'ik (61.1%, a difference of 3.2%), Tohono O'odham (56.7%, a difference of 4.4%), and Lumbee (56.2%, a difference of 5.3%).
| Demographics | Rating | Rank | Disability Age Over 75 |
| Apache | 0.0 /100 | #333 | Tragic 53.6% |
| Alaskan Athabascans | 0.0 /100 | #334 | Tragic 54.0% |
| Kiowa | 0.0 /100 | #335 | Tragic 54.2% |
| Immigrants | Armenia | 0.0 /100 | #336 | Tragic 54.3% |
| Yuman | 0.0 /100 | #337 | Tragic 54.4% |
| Colville | 0.0 /100 | #338 | Tragic 55.4% |
| Pima | 0.0 /100 | #339 | Tragic 55.8% |
| Pueblo | 0.0 /100 | #340 | Tragic 55.9% |
| Houma | 0.0 /100 | #341 | Tragic 56.2% |
| Lumbee | 0.0 /100 | #342 | Tragic 56.2% |
| Tohono O'odham | 0.0 /100 | #343 | Tragic 56.7% |
| Navajo | 0.0 /100 | #344 | Tragic 58.3% |
| Inupiat | 0.0 /100 | #345 | Tragic 58.4% |
| Tsimshian | 0.0 /100 | #346 | Tragic 59.2% |
| Yup'ik | 0.0 /100 | #347 | Tragic 61.1% |