Assyrian/Chaldean/Syriac vs Tsimshian Unemployment Among Ages 25 to 29 years
COMPARE
Assyrian/Chaldean/Syriac
Tsimshian
Unemployment Among Ages 25 to 29 years
Unemployment Among Ages 25 to 29 years Comparison
Assyrians/Chaldeans/Syriacs
Tsimshian
7.3%
UNEMPLOYMENT AMONG AGES 25 TO 29 YEARS
0.2/ 100
METRIC RATING
257th/ 347
METRIC RANK
8.0%
UNEMPLOYMENT AMONG AGES 25 TO 29 YEARS
0.0/ 100
METRIC RATING
305th/ 347
METRIC RANK
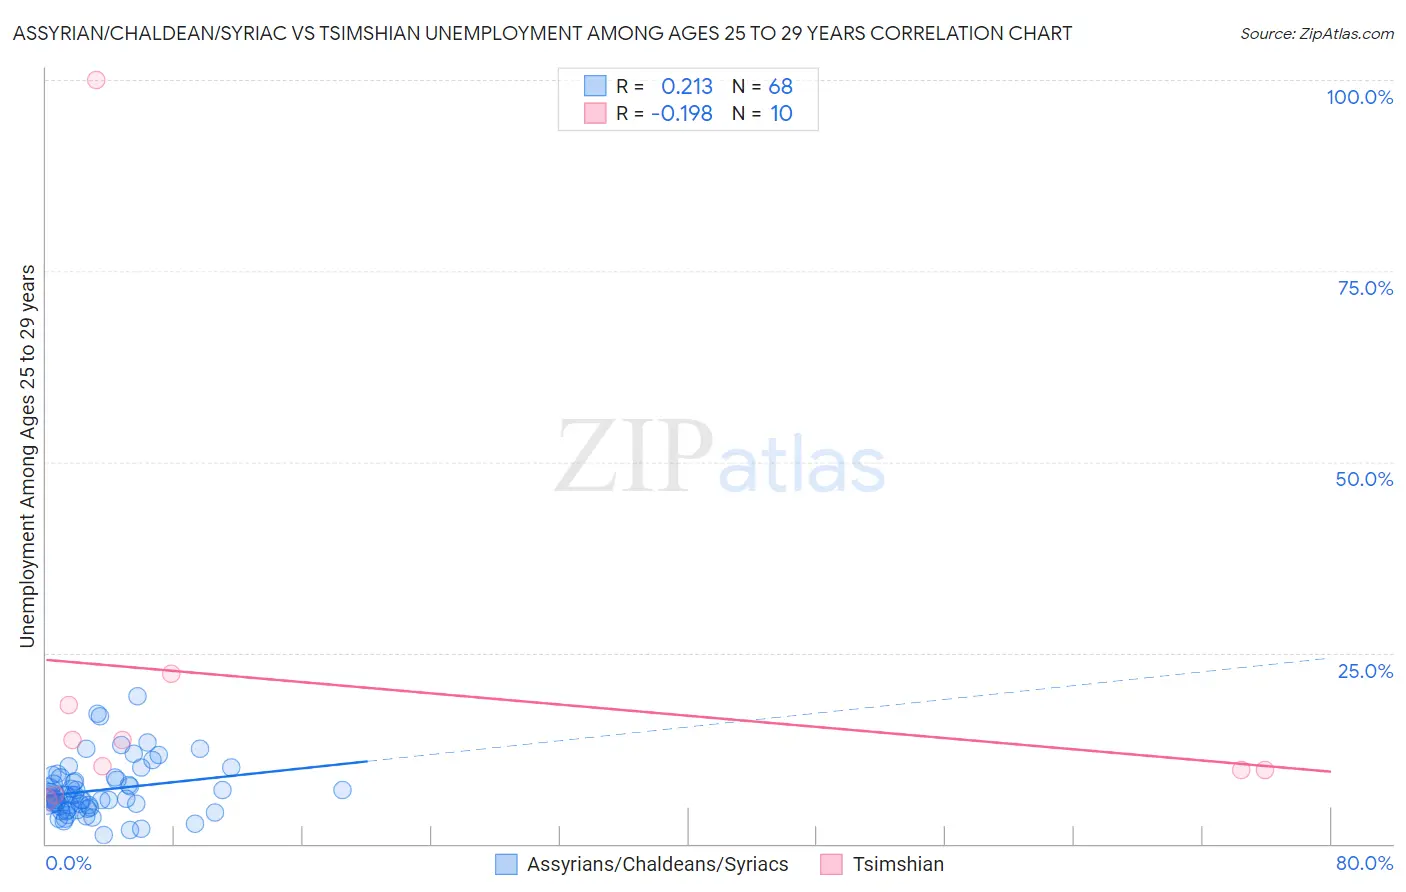
Assyrian/Chaldean/Syriac vs Tsimshian Unemployment Among Ages 25 to 29 years Correlation Chart
The statistical analysis conducted on geographies consisting of 108,796,100 people shows a weak positive correlation between the proportion of Assyrians/Chaldeans/Syriacs and unemployment rate among population between the ages 25 and 29 in the United States with a correlation coefficient (R) of 0.213 and weighted average of 7.3%. Similarly, the statistical analysis conducted on geographies consisting of 15,388,943 people shows a poor negative correlation between the proportion of Tsimshian and unemployment rate among population between the ages 25 and 29 in the United States with a correlation coefficient (R) of -0.198 and weighted average of 8.0%, a difference of 10.2%.
Unemployment Among Ages 25 to 29 years Correlation Summary
| Measurement | Assyrian/Chaldean/Syriac | Tsimshian |
| Minimum | 1.2% | 5.7% |
| Maximum | 19.3% | 100.0% |
| Range | 18.1% | 94.3% |
| Mean | 7.0% | 20.9% |
| Median | 6.3% | 11.9% |
| Interquartile 25% (IQ1) | 4.8% | 9.6% |
| Interquartile 75% (IQ3) | 8.6% | 18.2% |
| Interquartile Range (IQR) | 3.7% | 8.6% |
| Standard Deviation (Sample) | 3.6% | 28.3% |
| Standard Deviation (Population) | 3.6% | 26.8% |
Similar Demographics by Unemployment Among Ages 25 to 29 years
Demographics Similar to Assyrians/Chaldeans/Syriacs by Unemployment Among Ages 25 to 29 years
In terms of unemployment among ages 25 to 29 years, the demographic groups most similar to Assyrians/Chaldeans/Syriacs are Mexican American Indian (7.3%, a difference of 0.37%), Ottawa (7.3%, a difference of 0.40%), Immigrants from Cameroon (7.2%, a difference of 0.57%), Cree (7.3%, a difference of 0.61%), and Ghanaian (7.2%, a difference of 0.63%).
| Demographics | Rating | Rank | Unemployment Among Ages 25 to 29 years |
| Delaware | 0.5 /100 | #250 | Tragic 7.2% |
| Portuguese | 0.5 /100 | #251 | Tragic 7.2% |
| Sierra Leoneans | 0.4 /100 | #252 | Tragic 7.2% |
| Immigrants | Portugal | 0.3 /100 | #253 | Tragic 7.2% |
| Ghanaians | 0.3 /100 | #254 | Tragic 7.2% |
| Immigrants | Cameroon | 0.3 /100 | #255 | Tragic 7.2% |
| Mexican American Indians | 0.3 /100 | #256 | Tragic 7.3% |
| Assyrians/Chaldeans/Syriacs | 0.2 /100 | #257 | Tragic 7.3% |
| Ottawa | 0.1 /100 | #258 | Tragic 7.3% |
| Cree | 0.1 /100 | #259 | Tragic 7.3% |
| Americans | 0.1 /100 | #260 | Tragic 7.4% |
| Nigerians | 0.1 /100 | #261 | Tragic 7.4% |
| Ecuadorians | 0.1 /100 | #262 | Tragic 7.4% |
| Kiowa | 0.1 /100 | #263 | Tragic 7.4% |
| Immigrants | Western Africa | 0.1 /100 | #264 | Tragic 7.4% |
Demographics Similar to Tsimshian by Unemployment Among Ages 25 to 29 years
In terms of unemployment among ages 25 to 29 years, the demographic groups most similar to Tsimshian are Haitian (8.0%, a difference of 0.080%), Immigrants from Barbados (8.0%, a difference of 0.24%), Cajun (8.0%, a difference of 0.26%), Immigrants from Yemen (8.0%, a difference of 0.48%), and Immigrants from Jamaica (8.1%, a difference of 0.66%).
| Demographics | Rating | Rank | Unemployment Among Ages 25 to 29 years |
| Immigrants | Trinidad and Tobago | 0.0 /100 | #298 | Tragic 7.9% |
| Barbadians | 0.0 /100 | #299 | Tragic 7.9% |
| Central American Indians | 0.0 /100 | #300 | Tragic 7.9% |
| West Indians | 0.0 /100 | #301 | Tragic 7.9% |
| Jamaicans | 0.0 /100 | #302 | Tragic 7.9% |
| Immigrants | Yemen | 0.0 /100 | #303 | Tragic 8.0% |
| Cajuns | 0.0 /100 | #304 | Tragic 8.0% |
| Tsimshian | 0.0 /100 | #305 | Tragic 8.0% |
| Haitians | 0.0 /100 | #306 | Tragic 8.0% |
| Immigrants | Barbados | 0.0 /100 | #307 | Tragic 8.0% |
| Immigrants | Jamaica | 0.0 /100 | #308 | Tragic 8.1% |
| Immigrants | Haiti | 0.0 /100 | #309 | Tragic 8.1% |
| U.S. Virgin Islanders | 0.0 /100 | #310 | Tragic 8.1% |
| Immigrants | Azores | 0.0 /100 | #311 | Tragic 8.1% |
| Dutch West Indians | 0.0 /100 | #312 | Tragic 8.2% |